
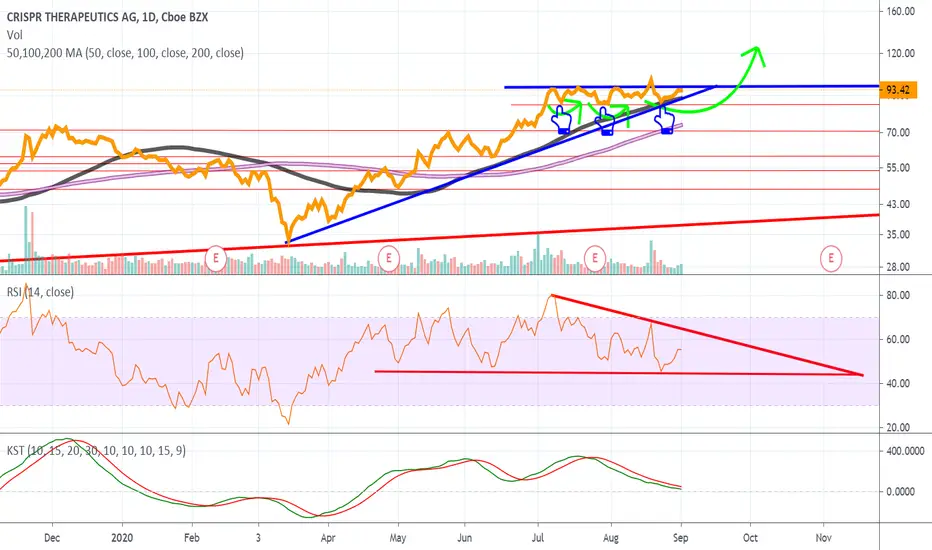
Notice the dark blue pattern on the chart, there's noticeably a Ascending Triangle and coincidentally a bullish inverted H&S where I have placed the green lines.
Above each green line is appears to be a bottom, and there's three very noticeable on the line chart as opposed to the hollow candle chart. I have placed three blue finger icons so there is no confusion, each finger represents a bottom of the Triple Bottom.
On the RSI there's was clearly a modest divergence, if the Ascending Triangle breakout to the upside the RSI is going to need to create a higher high and break out of the pattern to the upside negating the possibility of this ending in a bearish divergence & descending triangle.
Above each green line is appears to be a bottom, and there's three very noticeable on the line chart as opposed to the hollow candle chart. I have placed three blue finger icons so there is no confusion, each finger represents a bottom of the Triple Bottom.
On the RSI there's was clearly a modest divergence, if the Ascending Triangle breakout to the upside the RSI is going to need to create a higher high and break out of the pattern to the upside negating the possibility of this ending in a bearish divergence & descending triangle.

Publicações relacionadas
Aviso legal
As informações e publicações não se destinam a ser, e não constituem, conselhos ou recomendações financeiras, de investimento, comerciais ou de outro tipo fornecidos ou endossados pela TradingView. Leia mais nos Termos de Uso.
Publicações relacionadas
Aviso legal
As informações e publicações não se destinam a ser, e não constituem, conselhos ou recomendações financeiras, de investimento, comerciais ou de outro tipo fornecidos ou endossados pela TradingView. Leia mais nos Termos de Uso.