
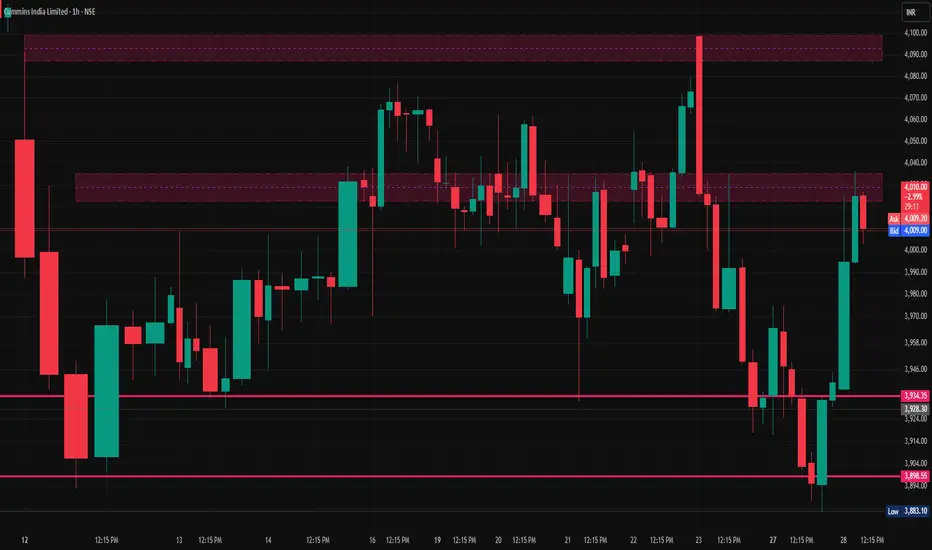
📌 Current Price Snapshot (Indicative, ~28 Jan 2026 mid‑session)
Approx Price: ₹4,004 – ₹4,016 on NSE (delayed/real‑time range)
📍 1‑Hour Time Frame / Intraday Pivot Levels
Pivot levels help identify key zones where price may react during the current session.
Central Pivot (CP)
CP (Pivot): ~₹3,928 – ₹3,929 (hourly reference)
🔼 Resistance Levels (Upside)
R1: ~₹4,020 – ₹4,021 — first major upside cap above pivot
R2: ~₹4,066 – ₹4,067 — next resistance zone from pivot calculations
R3: ~₹4,100 – ₹4,110 — broader extension resistance (calculated range)
🔽 Support Levels (Downside)
S1: ~₹3,902 – ₹3,903 — immediate support below pivot
S2: ~₹3,882 – ₹3,883 — secondary support zone
S3: ~₹3,790 – ₹3,791 — deeper support if price drops sharply
📈 Notes
🔹 These pivot levels are derived from intraday pivot calculations (Standard / Fibonacci / Camarilla methods) updated recently for the current session.
🔹 The current price is indicative and may be slightly delayed vs live feed – for ultra‑precise trading, use your broker chart with 1‑hour timeframe.
🔹 Support/resistance bands change as price moves; always verify on live charts.
Approx Price: ₹4,004 – ₹4,016 on NSE (delayed/real‑time range)
📍 1‑Hour Time Frame / Intraday Pivot Levels
Pivot levels help identify key zones where price may react during the current session.
Central Pivot (CP)
CP (Pivot): ~₹3,928 – ₹3,929 (hourly reference)
🔼 Resistance Levels (Upside)
R1: ~₹4,020 – ₹4,021 — first major upside cap above pivot
R2: ~₹4,066 – ₹4,067 — next resistance zone from pivot calculations
R3: ~₹4,100 – ₹4,110 — broader extension resistance (calculated range)
🔽 Support Levels (Downside)
S1: ~₹3,902 – ₹3,903 — immediate support below pivot
S2: ~₹3,882 – ₹3,883 — secondary support zone
S3: ~₹3,790 – ₹3,791 — deeper support if price drops sharply
📈 Notes
🔹 These pivot levels are derived from intraday pivot calculations (Standard / Fibonacci / Camarilla methods) updated recently for the current session.
🔹 The current price is indicative and may be slightly delayed vs live feed – for ultra‑precise trading, use your broker chart with 1‑hour timeframe.
🔹 Support/resistance bands change as price moves; always verify on live charts.

Publicações relacionadas
Aviso legal
As informações e publicações não se destinam a ser, e não constituem, conselhos ou recomendações financeiras, de investimento, comerciais ou de outro tipo fornecidos ou endossados pela TradingView. Leia mais nos Termos de Uso.
Publicações relacionadas
Aviso legal
As informações e publicações não se destinam a ser, e não constituem, conselhos ou recomendações financeiras, de investimento, comerciais ou de outro tipo fornecidos ou endossados pela TradingView. Leia mais nos Termos de Uso.