
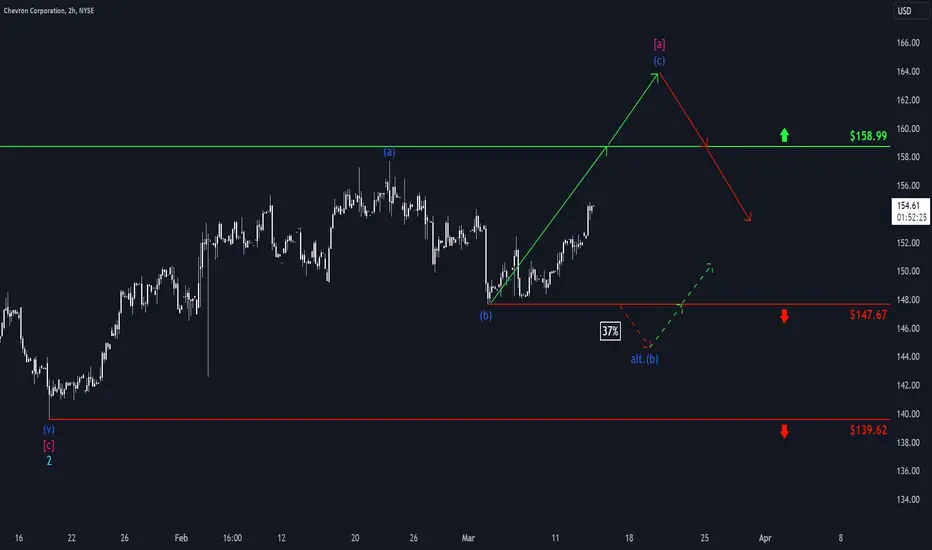
The Chevron stock price has established the low of the blue wave (b). Going forward, the blue wave (c) should now push the stock above the resistance at $158.99, so that the overarching wave (a) in magenta can be completed there. The next step should then see a significant sell-off. However, there is a 37% chance that the price will set a new low with the blue wave alt.(b) below the support at $147.67 (but still above the next support at $139.62).

📊 Daily market insights combining macro + Elliott Wave analysis
🚀 Spot trends early with momentum, sentiment & price structure
🌐 Join thousands trading smarter at hkcmglobal.com
🚀 Spot trends early with momentum, sentiment & price structure
🌐 Join thousands trading smarter at hkcmglobal.com
Aviso legal
As informações e publicações não se destinam a ser, e não constituem, conselhos ou recomendações financeiras, de investimento, comerciais ou de outro tipo fornecidos ou endossados pela TradingView. Leia mais nos Termos de Uso.