
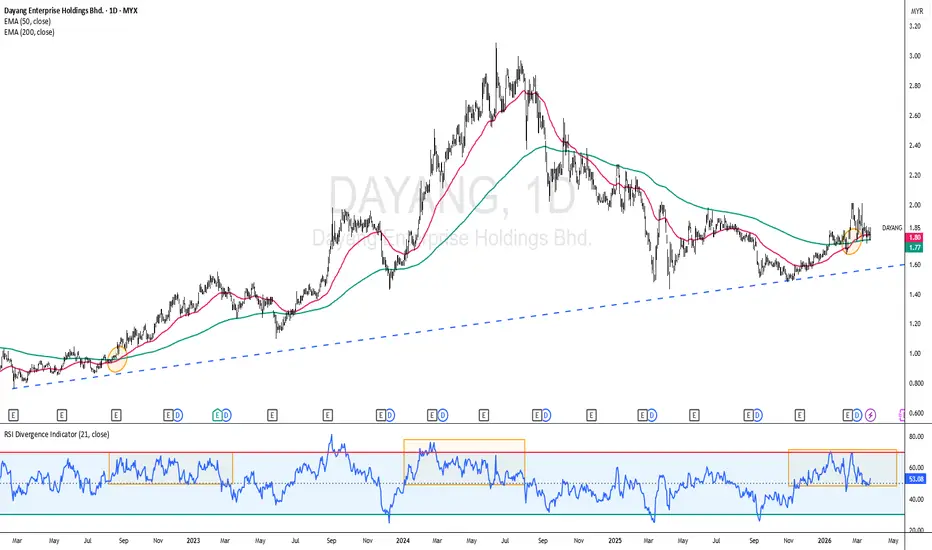
DAYANG - CURRENT PRICE : RM1.85
DAYANG is showing an improving position trading setup as momentum begins to shift after a prolonged downtrend. The RSI (21-day period) is now spending more time above the 50 level (highlighted in the orange rectangles), which previously led to a significant bullish expansion. A similar scenario may be developing again, suggesting the downtrend phase has likely ended and accumulation is underway.
From a trend perspective, EMA 50 has crossed above EMA 200, forming a golden cross — a strong medium-term bullish signal. The last golden cross in August 2022 (look at orange circle) preceded a sustained uptrend, and the current structure appears to be mirroring that behavior. Price is also holding above the rising trendline, reinforcing the bullish bias.
Technical risk-reward remains attractive for position traders as price consolidates near the moving averages with limited downside.
Trading Plan (Position Trade):
🔥Buy Zone: Current levels / minor pullback
🔥TP1: RM2.25 (21.62%)
🔥TP2: RM2.55 (37.84%)
🔥Support / Invalidation: 1.67 (-9.73%) --- (February 2026 bullish harami pattern low)
As long as price holds above 1.67, the structure favors trend continuation higher, with momentum expected to expand similar to previous RSI (21) above 50 phases.

Aviso legal
As informações e publicações não se destinam a ser, e não constituem, conselhos ou recomendações financeiras, de investimento, comerciais ou de outro tipo fornecidos ou endossados pela TradingView. Leia mais nos Termos de Uso.
Aviso legal
As informações e publicações não se destinam a ser, e não constituem, conselhos ou recomendações financeiras, de investimento, comerciais ou de outro tipo fornecidos ou endossados pela TradingView. Leia mais nos Termos de Uso.