
DIA (dow jones etf) - Support, Resistance, Trend - October 2021
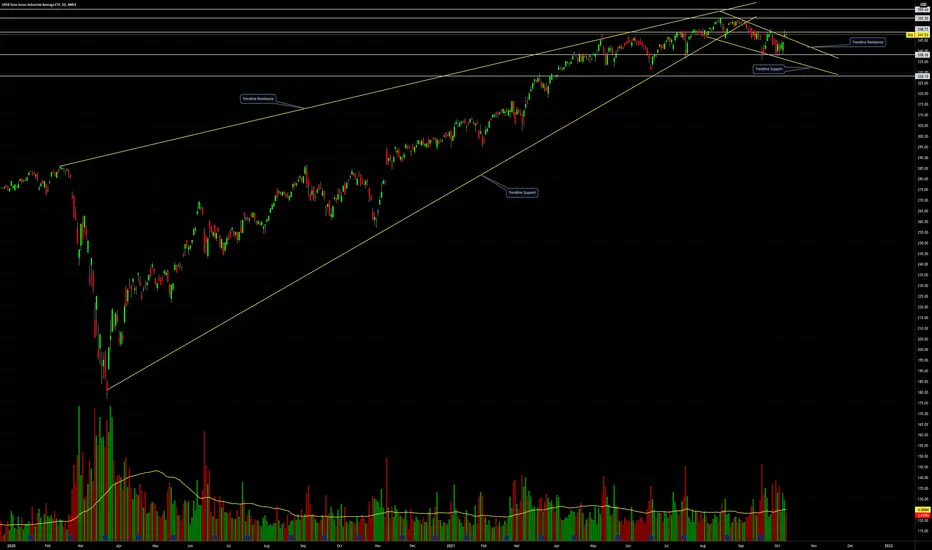
Dow Jones Index ETF has been in a daily downtrend since September 2021.
DIA price is currently above trendline resistance.
-Bullish scenario: price breaks and holds above $350 to $354.
-Bearish scenario: price falls below $344 to $338.
Resistance(s): $350, $352, $354, $355, $357, $359.
Support(s): $346, $344, $339, $335, $333, $331.
Q3 2021 earnings season is starting, and will likely be the catalyst for price volatility this month.
DIA price is currently above trendline resistance.
-Bullish scenario: price breaks and holds above $350 to $354.
-Bearish scenario: price falls below $344 to $338.
Resistance(s): $350, $352, $354, $355, $357, $359.
Support(s): $346, $344, $339, $335, $333, $331.
Q3 2021 earnings season is starting, and will likely be the catalyst for price volatility this month.

Follow Me on TradingView and Youtube.
Social Media links are in my profile.
Boost, comment, share to support.
All posts are not financial advice.
Social Media links are in my profile.
Boost, comment, share to support.
All posts are not financial advice.
Aviso legal
As informações e publicações não se destinam a ser, e não constituem, conselhos ou recomendações financeiras, de investimento, comerciais ou de outro tipo fornecidos ou endossados pela TradingView. Leia mais nos Termos de Uso.
Follow Me on TradingView and Youtube.
Social Media links are in my profile.
Boost, comment, share to support.
All posts are not financial advice.
Social Media links are in my profile.
Boost, comment, share to support.
All posts are not financial advice.
Aviso legal
As informações e publicações não se destinam a ser, e não constituem, conselhos ou recomendações financeiras, de investimento, comerciais ou de outro tipo fornecidos ou endossados pela TradingView. Leia mais nos Termos de Uso.