
Market Context & Structural Overview
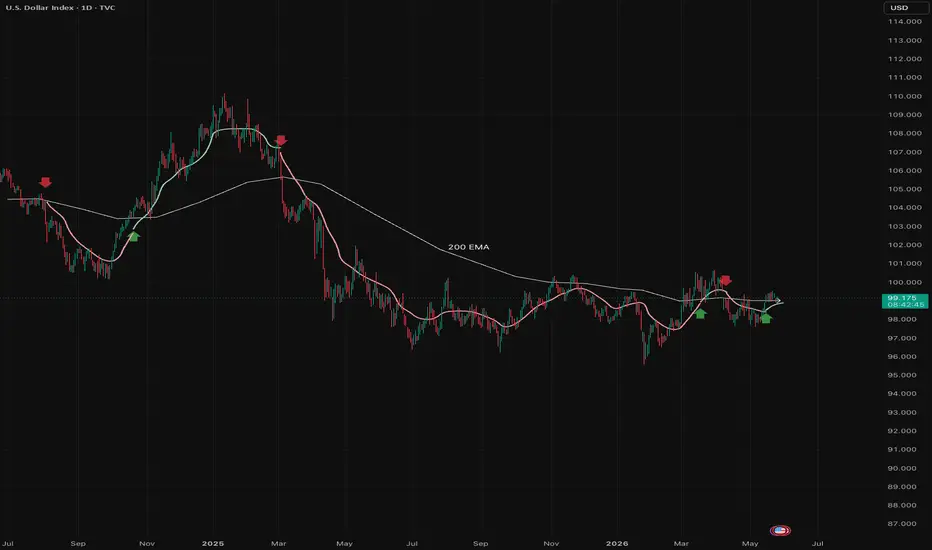
Looking at the U.S. Dollar Index (DXY) on the daily horizon, price action is currently undergoing a significant technical regime shift. This chart analysis highlights the transition from a long-term bearish distribution phase into a potential accumulation model, using standard quantitative volatility boundaries and moving average filters.
Technical Breakdown & Chart Elements:
The 200-Period Baseline (Thick White Line): This major exponential moving average serves as the primary macro trend filter. Throughout the entire structural decline in 2025, price action remained strictly capped below this dynamic resistance, confirming a persistent bearish market environment and filtering out premature counter-trend long attempts.
The Dynamic Trail & Momentum Ribbon: The adaptive trailing line acts as a localized structural support/resistance boundary. During the sustained markdown phase, the ribbon maintained a clear bearish posture, tracking the trend velocity without getting chopped up by minor technical pullbacks.
The Current Structural Shift (May 2026):
We are currently witnessing a crucial confluence of technical events. Price has successfully crossed and sustained above the 200-EMA baseline for the first time in months. Concurrently, the technical trend metrics have shifted to a BULLISH reading.
While the underlying trend intensity is currently classified as low/sideways (indicating an early breakout or re-accumulation phase), the recent clustering of technical demand triggers near the $98.840 zone establishes a strong structural floor.
Trading Outlook:
As long as the DXY maintains its structure above the key pivot area between $98.840 and $98.999, the medium-term bias shifts from bearish to constructive. A confirmed breakout past the recent local highs would validate this institutional accumulation model.
Major Support Invalidation: $98.840
Current Price Reference: $99.149
Technical Bias: Bullish Accumulation / Regime Change
Looking at the U.S. Dollar Index (DXY) on the daily horizon, price action is currently undergoing a significant technical regime shift. This chart analysis highlights the transition from a long-term bearish distribution phase into a potential accumulation model, using standard quantitative volatility boundaries and moving average filters.
Technical Breakdown & Chart Elements:
The 200-Period Baseline (Thick White Line): This major exponential moving average serves as the primary macro trend filter. Throughout the entire structural decline in 2025, price action remained strictly capped below this dynamic resistance, confirming a persistent bearish market environment and filtering out premature counter-trend long attempts.
The Dynamic Trail & Momentum Ribbon: The adaptive trailing line acts as a localized structural support/resistance boundary. During the sustained markdown phase, the ribbon maintained a clear bearish posture, tracking the trend velocity without getting chopped up by minor technical pullbacks.
The Current Structural Shift (May 2026):
We are currently witnessing a crucial confluence of technical events. Price has successfully crossed and sustained above the 200-EMA baseline for the first time in months. Concurrently, the technical trend metrics have shifted to a BULLISH reading.
While the underlying trend intensity is currently classified as low/sideways (indicating an early breakout or re-accumulation phase), the recent clustering of technical demand triggers near the $98.840 zone establishes a strong structural floor.
Trading Outlook:
As long as the DXY maintains its structure above the key pivot area between $98.840 and $98.999, the medium-term bias shifts from bearish to constructive. A confirmed breakout past the recent local highs would validate this institutional accumulation model.
Major Support Invalidation: $98.840
Current Price Reference: $99.149
Technical Bias: Bullish Accumulation / Regime Change

CH Invest and Trading
Aviso legal
As informações e publicações não se destinam a ser, e não constituem, conselhos ou recomendações financeiras, de investimento, comerciais ou de outro tipo fornecidos ou endossados pela TradingView. Leia mais nos Termos de Uso.
CH Invest and Trading
Aviso legal
As informações e publicações não se destinam a ser, e não constituem, conselhos ou recomendações financeiras, de investimento, comerciais ou de outro tipo fornecidos ou endossados pela TradingView. Leia mais nos Termos de Uso.