
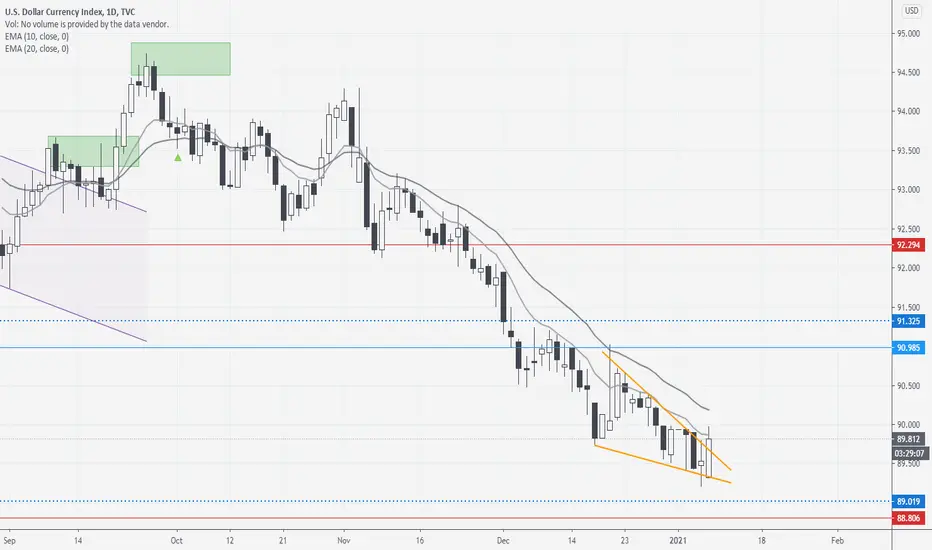
Currently at an area where price congested and broke higher to start a 23-month bull run in 2018-19.
LTF is showing a possible bottom with the formation of a higher high and a breakout from this descending wedge pattern.
Likely to see some kind of trading range before any decisive bullish breakout/reversal but today's candle is pretty bullish and the bulls would be looking to close the day strong. Context is okay for reversal here so we shall see.
A bearish break below 89 invalidates this view.
Weekly chart:

LTF is showing a possible bottom with the formation of a higher high and a breakout from this descending wedge pattern.
Likely to see some kind of trading range before any decisive bullish breakout/reversal but today's candle is pretty bullish and the bulls would be looking to close the day strong. Context is okay for reversal here so we shall see.
A bearish break below 89 invalidates this view.
Weekly chart:

Aviso legal
As informações e publicações não se destinam a ser, e não constituem, conselhos ou recomendações financeiras, de investimento, comerciais ou de outro tipo fornecidos ou endossados pela TradingView. Leia mais nos Termos de Uso.
Aviso legal
As informações e publicações não se destinam a ser, e não constituem, conselhos ou recomendações financeiras, de investimento, comerciais ou de outro tipo fornecidos ou endossados pela TradingView. Leia mais nos Termos de Uso.