
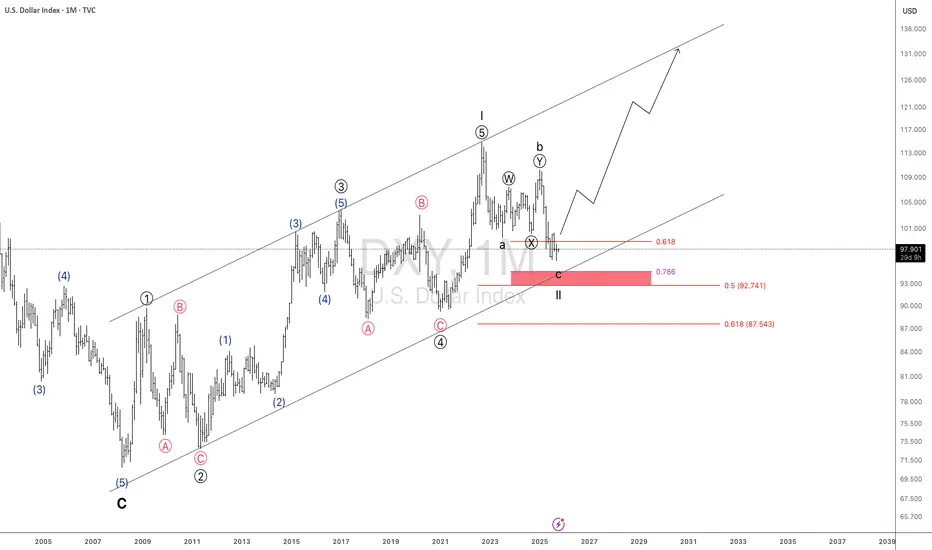
The U.S. Dollar Index (DXY) is currently in a major corrective structure after topping out in 2022. On the monthly chart, price action suggests we are in the final stages of a Wave II correction, with a potential bottom forming around key Fibonacci retracement levels.
The correction appears to be forming a WXY/ABC structure, with wave c in progress.
Price is currently within the 0.618 – 0.786 retracement zone of the prior impulse.
The long term ascending channel from 2008 lows remains intact, with support aligning around this Fib cluster.
A bullish reaction from this zone could trigger the beginning of Wave III, which historically is strong and impulsive.
Invalidation: Sustained break below 87.00 would weaken the bullish count
Targets:
1 = 132.91
2 = 141.88
If this count holds, DXY could be setting up for a multi-year bullish cycle, suggesting that the dollar may regain strength in the coming years, impacting major USD pairs across the board.
Disclaimer:
This analysis is for informational and educational purposes only and does not constitute financial advice. Markets are dynamic and unpredictable.
The correction appears to be forming a WXY/ABC structure, with wave c in progress.
Price is currently within the 0.618 – 0.786 retracement zone of the prior impulse.
The long term ascending channel from 2008 lows remains intact, with support aligning around this Fib cluster.
A bullish reaction from this zone could trigger the beginning of Wave III, which historically is strong and impulsive.
Invalidation: Sustained break below 87.00 would weaken the bullish count
Targets:
1 = 132.91
2 = 141.88
If this count holds, DXY could be setting up for a multi-year bullish cycle, suggesting that the dollar may regain strength in the coming years, impacting major USD pairs across the board.
Disclaimer:
This analysis is for informational and educational purposes only and does not constitute financial advice. Markets are dynamic and unpredictable.

Publicações relacionadas
Aviso legal
As informações e publicações não se destinam a ser, e não constituem, conselhos ou recomendações financeiras, de investimento, comerciais ou de outro tipo fornecidos ou endossados pela TradingView. Leia mais nos Termos de Uso.
Publicações relacionadas
Aviso legal
As informações e publicações não se destinam a ser, e não constituem, conselhos ou recomendações financeiras, de investimento, comerciais ou de outro tipo fornecidos ou endossados pela TradingView. Leia mais nos Termos de Uso.