
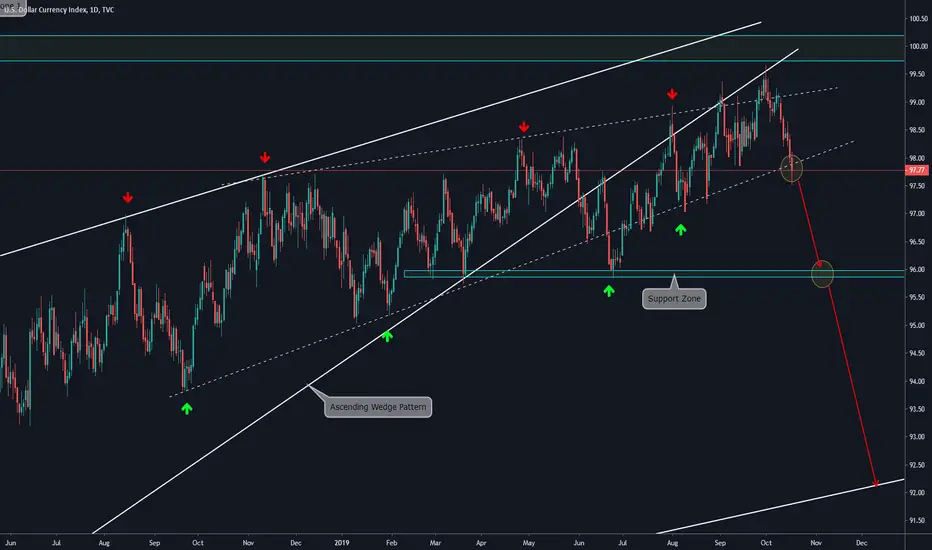
DAILY CHART EXPLANATION:
On this timeframe, we observe that the Dollar Index has been on a bullish movement since March '18. However, the last year, the bullish momentum started getting weaker forming a secondary wedge pattern below the Broken Main Wedge. It has bounced at the Top of the Wedge Pattern and at this moment price is breaking down the pattern. If it manages to consolidate below, the movement will be almost confirmed. We will look for a corrective structure on a lower timeframe to take short positions. The main target is the Support Zone at 96.00, and, if this zone is broken, then the Weekly Ascending Trendline will be the potential target area.
On this timeframe, we observe that the Dollar Index has been on a bullish movement since March '18. However, the last year, the bullish momentum started getting weaker forming a secondary wedge pattern below the Broken Main Wedge. It has bounced at the Top of the Wedge Pattern and at this moment price is breaking down the pattern. If it manages to consolidate below, the movement will be almost confirmed. We will look for a corrective structure on a lower timeframe to take short positions. The main target is the Support Zone at 96.00, and, if this zone is broken, then the Weekly Ascending Trendline will be the potential target area.

Publicações relacionadas
Aviso legal
As informações e publicações não se destinam a ser, e não constituem, conselhos ou recomendações financeiras, de investimento, comerciais ou de outro tipo fornecidos ou endossados pela TradingView. Leia mais nos Termos de Uso.
Publicações relacionadas
Aviso legal
As informações e publicações não se destinam a ser, e não constituem, conselhos ou recomendações financeiras, de investimento, comerciais ou de outro tipo fornecidos ou endossados pela TradingView. Leia mais nos Termos de Uso.