
"Super Swing Strategy" - Bollinger Bands, RSI, and ADX Strategy
Indicators Used:
- Bollinger Bands
- Relative Strength Index (RSI)
- Average Directional Index (ADX)
Bollinger Bands for volatility, RSI for overbought and oversold conditions, and ADX for strength of the trend.
How it Works:
Add Bollinger Bands, a 14-period RSI, and a 14-period ADX to your chart.
When the price touches the upper Bollinger Band, the RSI shows overbought conditions (above 70), and the ADX is above 20, it's a potential bearish signal.
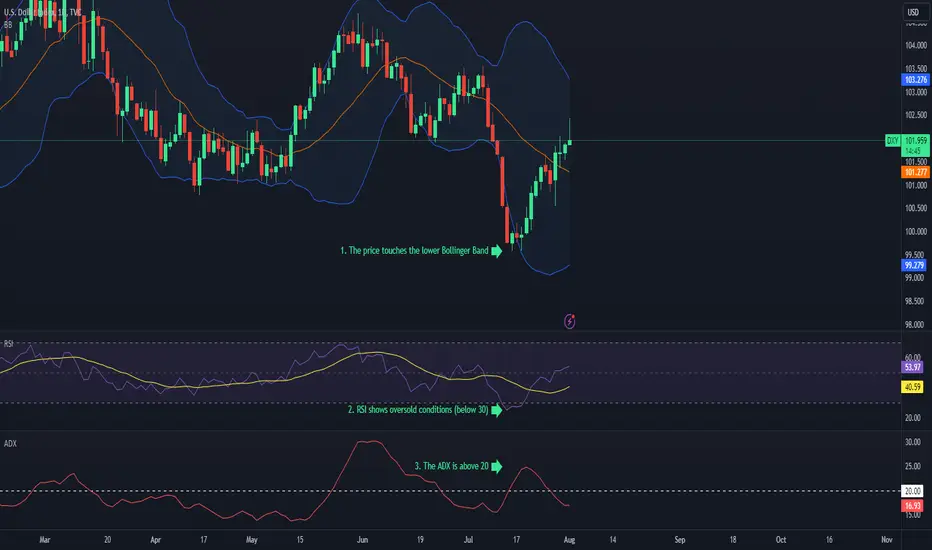
A bullish signal occurs when the price touches the lower Bollinger Band, the RSI shows oversold conditions (below 30), and the ADX is above 20.
You can use additional indicators or price action analysis to confirm signals.
Indicators Used:
- Bollinger Bands
- Relative Strength Index (RSI)
- Average Directional Index (ADX)
Bollinger Bands for volatility, RSI for overbought and oversold conditions, and ADX for strength of the trend.
How it Works:
Add Bollinger Bands, a 14-period RSI, and a 14-period ADX to your chart.
When the price touches the upper Bollinger Band, the RSI shows overbought conditions (above 70), and the ADX is above 20, it's a potential bearish signal.
A bullish signal occurs when the price touches the lower Bollinger Band, the RSI shows oversold conditions (below 30), and the ADX is above 20.
You can use additional indicators or price action analysis to confirm signals.

Aviso legal
As informações e publicações não se destinam a ser, e não constituem, conselhos ou recomendações financeiras, de investimento, comerciais ou de outro tipo fornecidos ou endossados pela TradingView. Leia mais nos Termos de Uso.
Aviso legal
As informações e publicações não se destinam a ser, e não constituem, conselhos ou recomendações financeiras, de investimento, comerciais ou de outro tipo fornecidos ou endossados pela TradingView. Leia mais nos Termos de Uso.