Long
EMC2 Post pump, possible continuation.
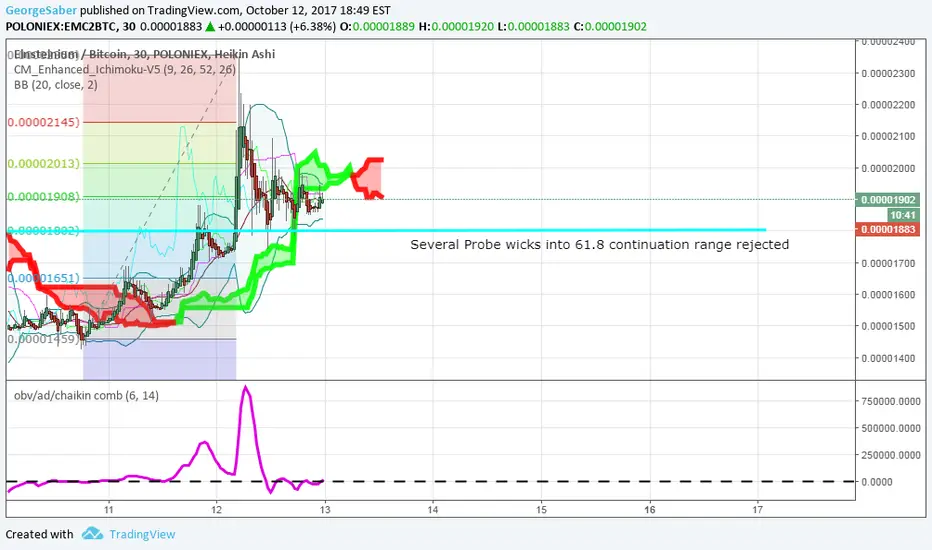
Last night's unexpected pump left EMC2 trading above 61.8 fib, continuation level;
Several probe wicks into 61.8 where rejected and eaten up.
I entered this trade just now, hoping for a continuation.
Chart appears to be at a volatile level, with Bollinger Bands tightening on the 30min time frame.
2hour chart shows all candles closing above red OBV chart; hence Bullish.
Yesterday's pump showed massive bullish wicks, and volume on bittrex is at 1700
OBV showing reduced selling/distribution.
I'm in and long; tell me if I'm wrong.

Aviso legal
As informações e publicações não se destinam a ser, e não constituem, conselhos ou recomendações financeiras, de investimento, comerciais ou de outro tipo fornecidos ou endossados pela TradingView. Leia mais nos Termos de Uso.
Aviso legal
As informações e publicações não se destinam a ser, e não constituem, conselhos ou recomendações financeiras, de investimento, comerciais ou de outro tipo fornecidos ou endossados pela TradingView. Leia mais nos Termos de Uso.