Long
EOSUSDT
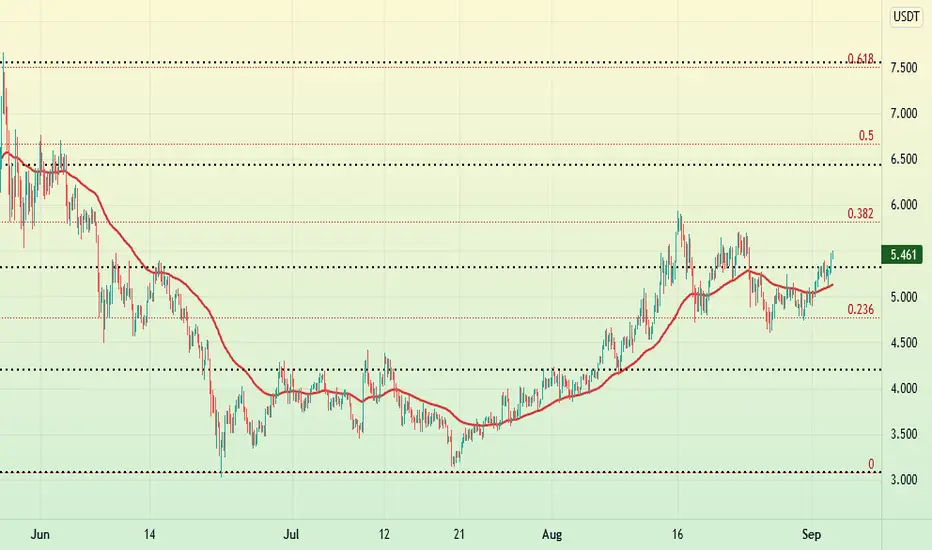
Look at black dotted lines on my chart...
They are support & resistance for moving average thats mean when MA cross above or below this lines,Price starting to Reaction
For example On EOS 4H chart when MA cross above 5.31 line, price will go to the next resistance on 6.4 & 7.5
Crossing MA on upper time frame like Daily, Weekly , ... will be bigger but i prefer to work on 4H time frame

Aviso legal
As informações e publicações não se destinam a ser, e não constituem, conselhos ou recomendações financeiras, de investimento, comerciais ou de outro tipo fornecidos ou endossados pela TradingView. Leia mais nos Termos de Uso.
Aviso legal
As informações e publicações não se destinam a ser, e não constituem, conselhos ou recomendações financeiras, de investimento, comerciais ou de outro tipo fornecidos ou endossados pela TradingView. Leia mais nos Termos de Uso.