
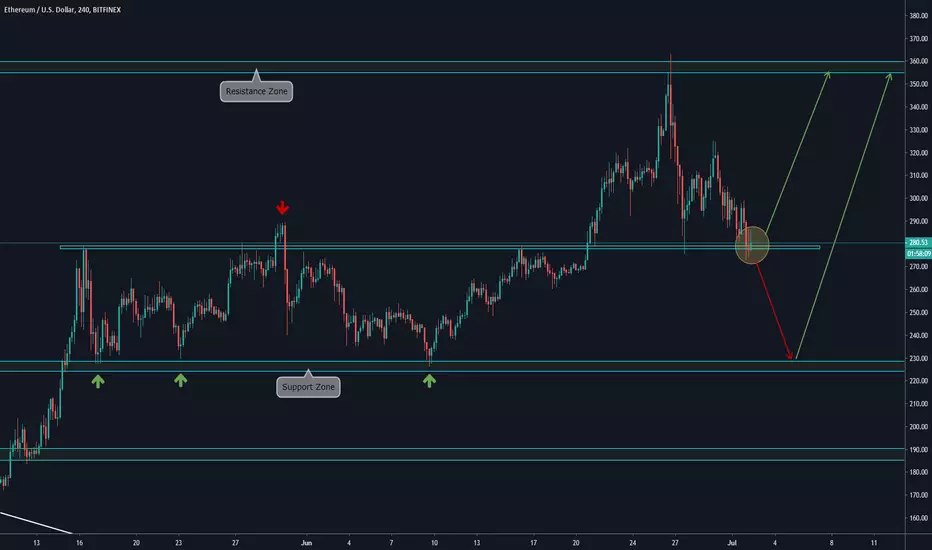
4H CHART EXPLANATION:
At this moment price is facing a support zone (previous resistance zone) that holded the price many times before breaking upwards. So, it is a nice reversal point for Ethereum, and to place a long trade it would be safe to wait for a price action confirmation such a candlestich pattern.
In case this level can not hold the price correctly, we expect another downside movement towards the lower Support Zone at 230-240 and a bounce from there.
MULTI TIMEFRAME VISION:
-Daily:

-Weekly:

At this moment price is facing a support zone (previous resistance zone) that holded the price many times before breaking upwards. So, it is a nice reversal point for Ethereum, and to place a long trade it would be safe to wait for a price action confirmation such a candlestich pattern.
In case this level can not hold the price correctly, we expect another downside movement towards the lower Support Zone at 230-240 and a bounce from there.
MULTI TIMEFRAME VISION:
-Daily:
-Weekly:

Aviso legal
As informações e publicações não se destinam a ser, e não constituem, conselhos ou recomendações financeiras, de investimento, comerciais ou de outro tipo fornecidos ou endossados pela TradingView. Leia mais nos Termos de Uso.
Aviso legal
As informações e publicações não se destinam a ser, e não constituem, conselhos ou recomendações financeiras, de investimento, comerciais ou de outro tipo fornecidos ou endossados pela TradingView. Leia mais nos Termos de Uso.