 ETHUSD
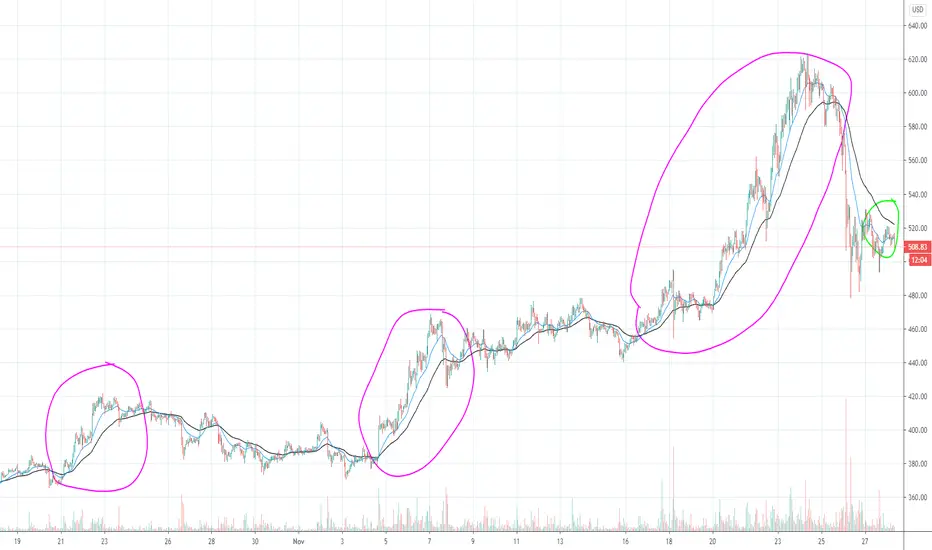
 Here is some more analysis using EMAs looking at 1 hour candles.
You can see with each pink circle, once the EMA20 (blue line) crosses above the EMA50 (black line) we enter a bullish period. This spike continues until EMAs even out and the EMA50 crosses back over. Looking at the green circle we see EMA50 is currently still above, once that turns we are bullish.
These two EMAs are very standard for cryptocurrency analysis.
This is not financial advice! Please trade at your own risk.

Aviso legal
As informações e publicações não se destinam a ser, e não constituem, conselhos ou recomendações financeiras, de investimento, comerciais ou de outro tipo fornecidos ou endossados pela TradingView. Leia mais nos Termos de Uso.
Aviso legal
As informações e publicações não se destinam a ser, e não constituem, conselhos ou recomendações financeiras, de investimento, comerciais ou de outro tipo fornecidos ou endossados pela TradingView. Leia mais nos Termos de Uso.