
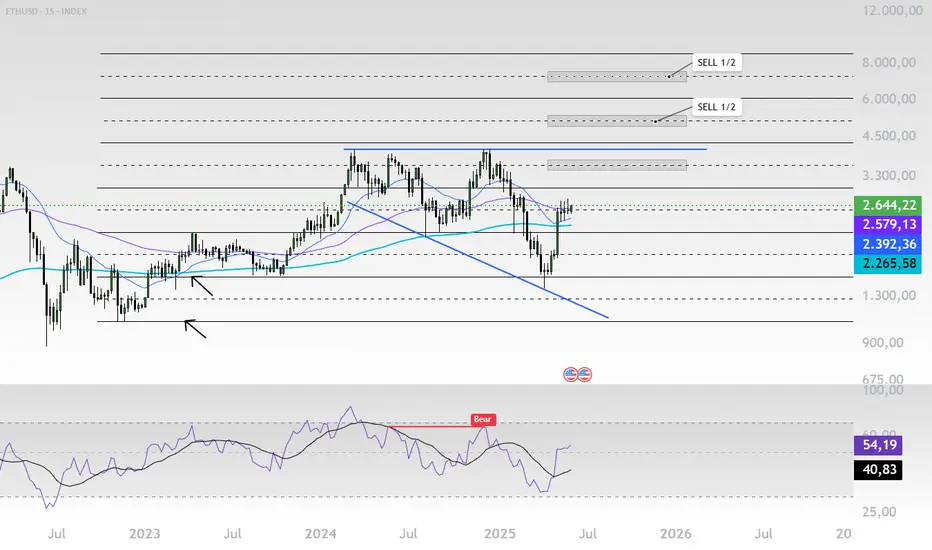
The Ethereum weekly chart reveals a clear cyclical structure aligned with Market Frequency Theory, which posits that asset prices move in repetitive behavioral waves—accumulation, expansion, distribution, and correction—driven by liquidity zones and institutional interest.
After bottoming in late 2022, ETH entered a new expansion phase, breaking above key moving averages and confirming a bullish shift in frequency. The recent drop to the $1,500 zone served as a liquidity sweep, followed by a strong rebound and current consolidation above the $2,265–$2,643 range. This area now acts as a high-frequency support band.
Key resistance zones projected through historical frequency levels lie at $3,300, $4,500, $6,000, and $8,000, with marked targets labeled “SELL 1/2.” These areas coincide with previous tops and expected institutional take-profit zones, reflecting cyclical price symmetry.
Moving averages (50, 100, and 200 weeks) are turning bullish again, supporting a potential wave 3-type expansion. The RSI has broken a bearish structure and is trending higher, confirming a shift in relative strength frequency from bearish to bullish.
In summary, ETH appears to be entering a renewed bullish cycle, with price action and indicators suggesting continuation toward the $3,300–$6,000 range. As long as price holds above the $2,392–$2,579 band, the bullish frequency remains intact.
After bottoming in late 2022, ETH entered a new expansion phase, breaking above key moving averages and confirming a bullish shift in frequency. The recent drop to the $1,500 zone served as a liquidity sweep, followed by a strong rebound and current consolidation above the $2,265–$2,643 range. This area now acts as a high-frequency support band.
Key resistance zones projected through historical frequency levels lie at $3,300, $4,500, $6,000, and $8,000, with marked targets labeled “SELL 1/2.” These areas coincide with previous tops and expected institutional take-profit zones, reflecting cyclical price symmetry.
Moving averages (50, 100, and 200 weeks) are turning bullish again, supporting a potential wave 3-type expansion. The RSI has broken a bearish structure and is trending higher, confirming a shift in relative strength frequency from bearish to bullish.
In summary, ETH appears to be entering a renewed bullish cycle, with price action and indicators suggesting continuation toward the $3,300–$6,000 range. As long as price holds above the $2,392–$2,579 band, the bullish frequency remains intact.

Aviso legal
As informações e publicações não se destinam a ser, e não constituem, conselhos ou recomendações financeiras, de investimento, comerciais ou de outro tipo fornecidos ou endossados pela TradingView. Leia mais nos Termos de Uso.
Aviso legal
As informações e publicações não se destinam a ser, e não constituem, conselhos ou recomendações financeiras, de investimento, comerciais ou de outro tipo fornecidos ou endossados pela TradingView. Leia mais nos Termos de Uso.