
📈 ETH/USD Analysis – Potential Pullback Before the Next Bullish Leg
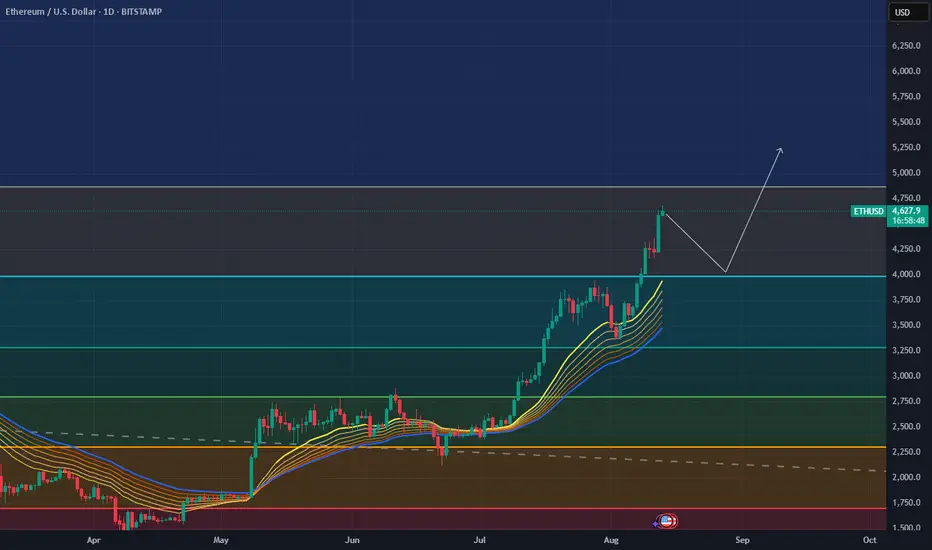
Ethereum is currently trading at $4,622 after an impressive rally. The price has reached a key resistance zone (~$4,700), where a short-term correction could occur.
Key insights:
EMA ribbons show a strong bullish trend – all moving averages are aligned upward and acting as dynamic support.
Fibonacci levels indicate the nearest major support around $4,000 (blue horizontal line).
Scenario: a possible retracement toward the ~$4,000 area, followed by a bounce targeting $5,250 and beyond.
Conclusion:
In the short term, we might see a healthy pullback, but the overall market structure remains strongly bullish. Strategically, watching the reaction at the $4,000 support zone could offer a good buying opportunity.
Ethereum is currently trading at $4,622 after an impressive rally. The price has reached a key resistance zone (~$4,700), where a short-term correction could occur.
Key insights:
EMA ribbons show a strong bullish trend – all moving averages are aligned upward and acting as dynamic support.
Fibonacci levels indicate the nearest major support around $4,000 (blue horizontal line).
Scenario: a possible retracement toward the ~$4,000 area, followed by a bounce targeting $5,250 and beyond.
Conclusion:
In the short term, we might see a healthy pullback, but the overall market structure remains strongly bullish. Strategically, watching the reaction at the $4,000 support zone could offer a good buying opportunity.
Trade ativo

Publicações relacionadas
Aviso legal
As informações e publicações não se destinam a ser, e não constituem, conselhos ou recomendações financeiras, de investimento, comerciais ou de outro tipo fornecidos ou endossados pela TradingView. Leia mais nos Termos de Uso.
Publicações relacionadas
Aviso legal
As informações e publicações não se destinam a ser, e não constituem, conselhos ou recomendações financeiras, de investimento, comerciais ou de outro tipo fornecidos ou endossados pela TradingView. Leia mais nos Termos de Uso.