
ETH technical analysis update
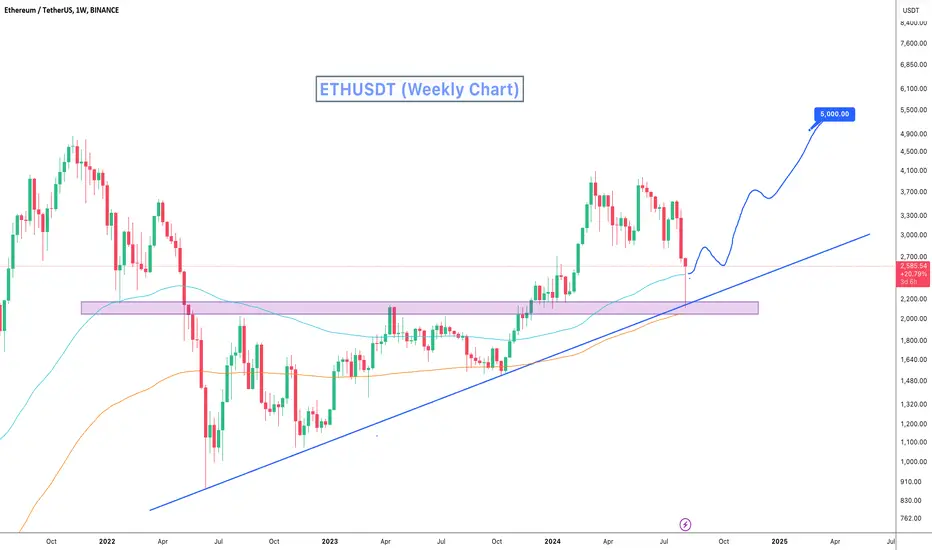
ETH's price touched the trend support line on the weekly chart and has bounced 20% from it. The price also touched the April resistance level at $2,150, which is now acting as strong support.
Price dropped below 30 RSI in day chart, this could indicate the bottom for ETH. The 100 and 200 EMA act as agood support for ETH in weekly chart. We can expect a significant bullish move from the current level, with the potential to reach a new all-time high in the coming months.
Regards
Hexa
ETH's price touched the trend support line on the weekly chart and has bounced 20% from it. The price also touched the April resistance level at $2,150, which is now acting as strong support.
Price dropped below 30 RSI in day chart, this could indicate the bottom for ETH. The 100 and 200 EMA act as agood support for ETH in weekly chart. We can expect a significant bullish move from the current level, with the potential to reach a new all-time high in the coming months.
Regards
Hexa


🚀Telegram : t.me/hexatrades
🌐Website: hexatrades.io/
🗣️Twitter(X): twitter.com/HexaTrades
🌐Website: hexatrades.io/
🗣️Twitter(X): twitter.com/HexaTrades
Publicações relacionadas
Aviso legal
As informações e publicações não se destinam a ser, e não constituem, conselhos ou recomendações financeiras, de investimento, comerciais ou de outro tipo fornecidos ou endossados pela TradingView. Leia mais nos Termos de Uso.
🚀Telegram : t.me/hexatrades
🌐Website: hexatrades.io/
🗣️Twitter(X): twitter.com/HexaTrades
🌐Website: hexatrades.io/
🗣️Twitter(X): twitter.com/HexaTrades
Publicações relacionadas
Aviso legal
As informações e publicações não se destinam a ser, e não constituem, conselhos ou recomendações financeiras, de investimento, comerciais ou de outro tipo fornecidos ou endossados pela TradingView. Leia mais nos Termos de Uso.