
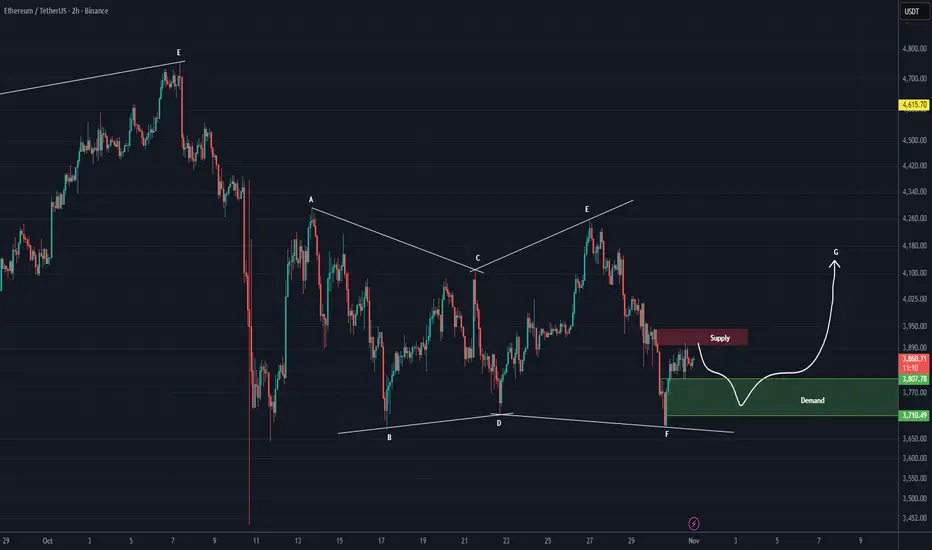
In the lower timeframes, after the major dump forming wave A, it seems that wave B has developed as a diametric pattern, with one remaining leg wave g. Wave g is bullish and could target the levels marked on the chart:
targets : 3920$ - 4038$ _ 4142$
The green zone represents the entry area, which is likely to be retested.
For risk management, please don't forget stop loss and capital management
When we reach the first target, save some profit and then change the stop to entry
Comment if you have any questions
Thank You
targets : 3920$ - 4038$ _ 4142$
The green zone represents the entry area, which is likely to be retested.
For risk management, please don't forget stop loss and capital management
When we reach the first target, save some profit and then change the stop to entry
Comment if you have any questions
Thank You

🔥 Don't Just Watch the Market. Understand It!
📊 Crypto Analysis & Setups:
👉 t.me/Behdark_EN
💹 Forex Analysis & Setups:
👉 t.me/FX_Behdark
🚀 Join BehDark for Market Insights, Trading Setups & Key Levels. Choose Your Market & Join Us!
📊 Crypto Analysis & Setups:
👉 t.me/Behdark_EN
💹 Forex Analysis & Setups:
👉 t.me/FX_Behdark
🚀 Join BehDark for Market Insights, Trading Setups & Key Levels. Choose Your Market & Join Us!
Aviso legal
As informações e publicações não se destinam a ser, e não constituem, conselhos ou recomendações financeiras, de investimento, comerciais ou de outro tipo fornecidos ou endossados pela TradingView. Leia mais nos Termos de Uso.
🔥 Don't Just Watch the Market. Understand It!
📊 Crypto Analysis & Setups:
👉 t.me/Behdark_EN
💹 Forex Analysis & Setups:
👉 t.me/FX_Behdark
🚀 Join BehDark for Market Insights, Trading Setups & Key Levels. Choose Your Market & Join Us!
📊 Crypto Analysis & Setups:
👉 t.me/Behdark_EN
💹 Forex Analysis & Setups:
👉 t.me/FX_Behdark
🚀 Join BehDark for Market Insights, Trading Setups & Key Levels. Choose Your Market & Join Us!
Aviso legal
As informações e publicações não se destinam a ser, e não constituem, conselhos ou recomendações financeiras, de investimento, comerciais ou de outro tipo fornecidos ou endossados pela TradingView. Leia mais nos Termos de Uso.