
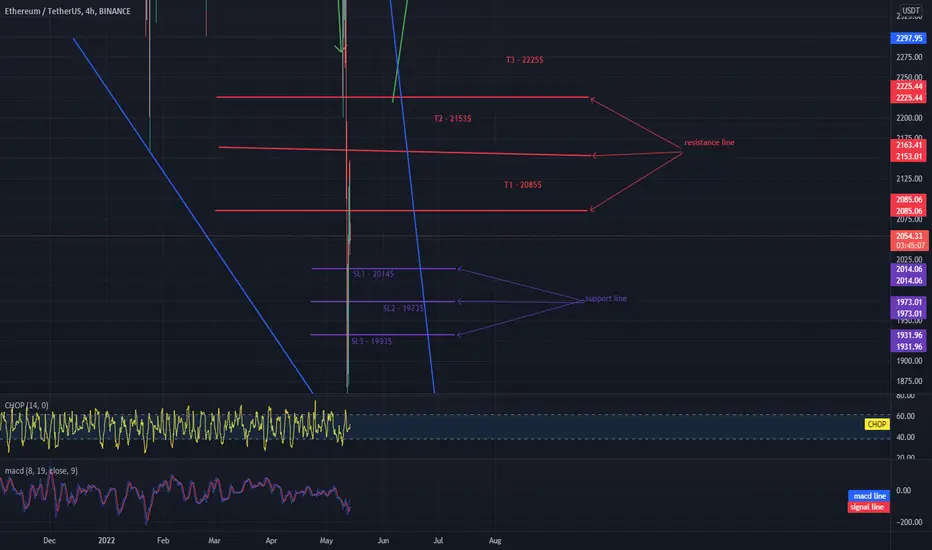
Hello everyone, let's take a look at the ETH to USDT chart over the 4 hour timeframe. As you can see, the price is moving in the triangle of the downturn channel.
Let's start by designating short term stop losses, as you can see:
SL1 - $ 2014,
SL2 - $ 1973
and
SL3 - $ 1933.
Now let's move on to determining the targets that we should take into account in the coming hours:
T1 - $ 2,085,
T2 - $ 2,153
and
T3 - $ 2,225.
Looking at the CHOP indicator, we can see that at the 4H interval, the energy starts to rise again, while the MACD indicator shows an uptrend.
Let's start by designating short term stop losses, as you can see:
SL1 - $ 2014,
SL2 - $ 1973
and
SL3 - $ 1933.
Now let's move on to determining the targets that we should take into account in the coming hours:
T1 - $ 2,085,
T2 - $ 2,153
and
T3 - $ 2,225.
Looking at the CHOP indicator, we can see that at the 4H interval, the energy starts to rise again, while the MACD indicator shows an uptrend.

Aviso legal
As informações e publicações não se destinam a ser, e não constituem, conselhos ou recomendações financeiras, de investimento, comerciais ou de outro tipo fornecidos ou endossados pela TradingView. Leia mais nos Termos de Uso.
Aviso legal
As informações e publicações não se destinam a ser, e não constituem, conselhos ou recomendações financeiras, de investimento, comerciais ou de outro tipo fornecidos ou endossados pela TradingView. Leia mais nos Termos de Uso.