
Ethereum (ETH) technical analysis:
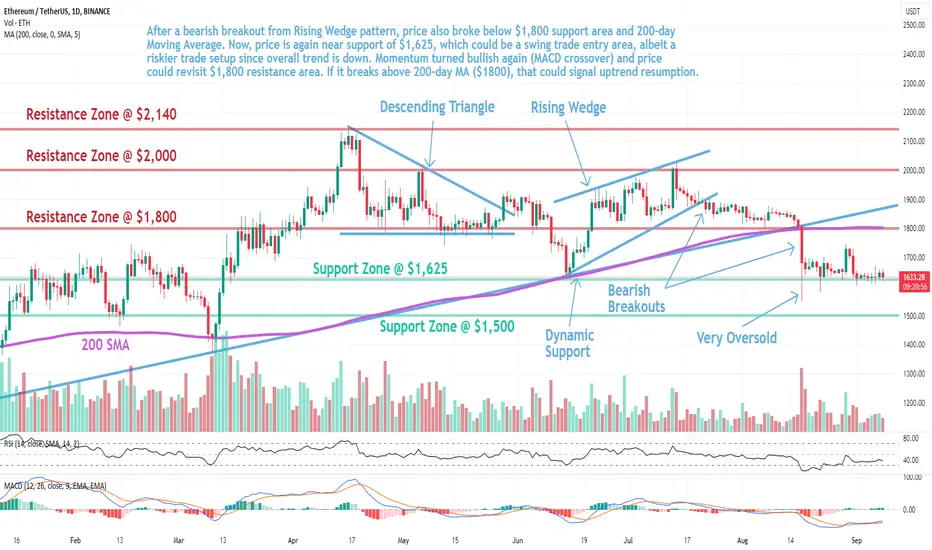
Trade setup: After a bearish breakout from Rising Wedge pattern, price also broke below $1,800 support area and 200-day Moving Average. Now, price is again near support of $1,625, which could be a swing trade entry area, albeit a riskier trade setup since overall trend is down. Momentum turned bullish again (MACD crossover) and price could revisit $1,800 resistance area. If it breaks above 200-day MA ($1800), that could signal uptrend resumption.
Trend: Downtrend across all time horizons (Short- Medium- and Long-Term).
Momentum is Mixed as MACD Line is above MACD Signal Line (Bullish) but RSI < 45 (Bearish).
Support and Resistance: Nearest Support Zone is $1,625, then $1,500. The nearest Resistance Zone is $1,800 (previous support), then $2,000 and $2,140.
Trade setup: After a bearish breakout from Rising Wedge pattern, price also broke below $1,800 support area and 200-day Moving Average. Now, price is again near support of $1,625, which could be a swing trade entry area, albeit a riskier trade setup since overall trend is down. Momentum turned bullish again (MACD crossover) and price could revisit $1,800 resistance area. If it breaks above 200-day MA ($1800), that could signal uptrend resumption.
Trend: Downtrend across all time horizons (Short- Medium- and Long-Term).
Momentum is Mixed as MACD Line is above MACD Signal Line (Bullish) but RSI < 45 (Bearish).
Support and Resistance: Nearest Support Zone is $1,625, then $1,500. The nearest Resistance Zone is $1,800 (previous support), then $2,000 and $2,140.

Aviso legal
As informações e publicações não se destinam a ser, e não constituem, conselhos ou recomendações financeiras, de investimento, comerciais ou de outro tipo fornecidos ou endossados pela TradingView. Leia mais nos Termos de Uso.
Aviso legal
As informações e publicações não se destinam a ser, e não constituem, conselhos ou recomendações financeiras, de investimento, comerciais ou de outro tipo fornecidos ou endossados pela TradingView. Leia mais nos Termos de Uso.