
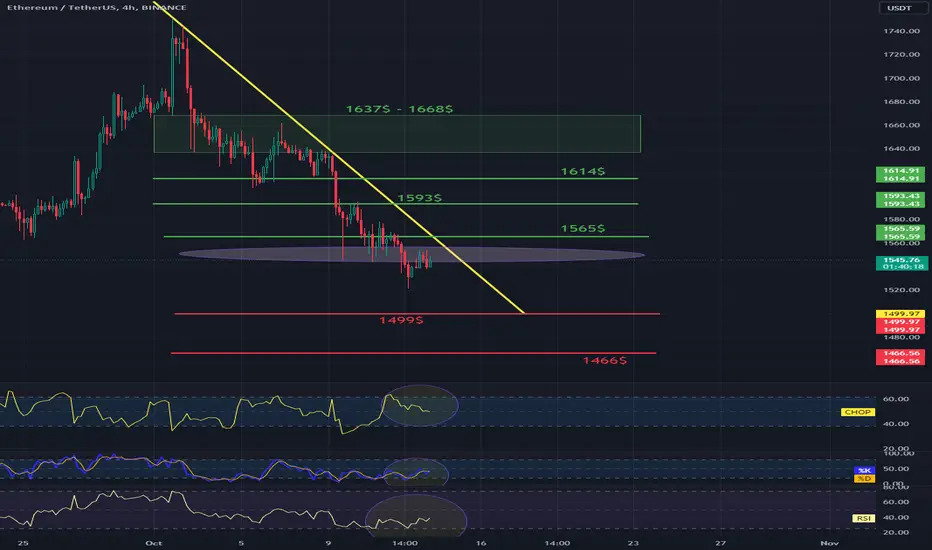
Hello everyone, let's take a look at the ETH to USDT chart on a 4-hour time frame. As you can see, the price is moving just below the local downtrend line.
After unfolding the Trend Based Fib Extension grid, we see that the price remains under support, while the next support is at $1,499, and further at $1,466.
Looking the other way, the first resistance is at $1,565, then we have resistance at $1,593, the next resistance at $1,614, and then we have the resistance zone from $1,637 to $1,668.
Looking at the CHOP indicator, we see that there is still energy for movement, on the STOCH indicator we have a slight rebound with room for growth, while the RSI indicator is moving towards the lower limit and we are currently experiencing a slight increase.
After unfolding the Trend Based Fib Extension grid, we see that the price remains under support, while the next support is at $1,499, and further at $1,466.
Looking the other way, the first resistance is at $1,565, then we have resistance at $1,593, the next resistance at $1,614, and then we have the resistance zone from $1,637 to $1,668.
Looking at the CHOP indicator, we see that there is still energy for movement, on the STOCH indicator we have a slight rebound with room for growth, while the RSI indicator is moving towards the lower limit and we are currently experiencing a slight increase.

Aviso legal
As informações e publicações não se destinam a ser, e não constituem, conselhos ou recomendações financeiras, de investimento, comerciais ou de outro tipo fornecidos ou endossados pela TradingView. Leia mais nos Termos de Uso.
Aviso legal
As informações e publicações não se destinam a ser, e não constituem, conselhos ou recomendações financeiras, de investimento, comerciais ou de outro tipo fornecidos ou endossados pela TradingView. Leia mais nos Termos de Uso.