
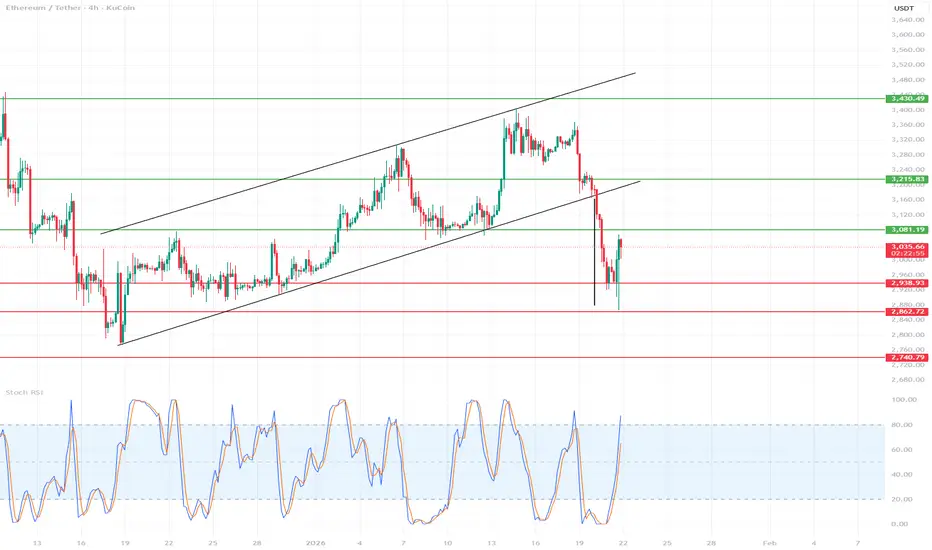
1️⃣ Market Structure (HTF – 4H)
We had a clear uptrend in the channel (black lines).
A breakout from the channel occurred at the bottom → this is a break of structure.
The decline was impulsive, without any major corrections → supply prevailed.
➡️ Medium-term bias: bearish/corrective
2️⃣ Key price levels
🔴 Supports
$2,938 – currently the closest technical support
$2,862 – a very important zone (strong reaction, long wick)
$2,740 – next HTF support (if the market collapses)
➡️ 2,862 = key decision level
Loss → high chance of a breakout to 2,740
🟢 Resistances
$3,081 – local resistance/flip after a breakout
$3,215 – former support, now resistance (ideal for shorts)
$3,430 – upper HTF resistance (only after a structure change)
3️⃣ Price Action (what we're seeing now)
After a strong dump, an impulsive downward wick appeared → Possible short-term relief (dead cat bounce).
The current bounce looks corrective, not impulsive.
Not yet:
higher low
4-hour candlestick closes above 3,081
➡️ This could still be just a pullback for further declines.
4️⃣ RSI Stochastic
RSI was heavily oversold → a technical bounce is normal.
Now a quick return to the upper regions → watch out for a bearish cross.
In downtrends, the Stoch RSI often:
Quickly reaches 80–100
and immediately reverses
➡️ RSI does not yet confirm a trend change
5️⃣ Scenarios
🟡 Scenario A – correction and further decline (more likely)
Bounce to 3,080–3,215
Rejection
Return to 2,860 → 2,740
📉 Short setup:
Reaction below 3,080 / 3,215
Weak volume, pin bar / bearish engulfing
🟢 Scenario B – return to growth (less likely)
Conditions:
4-hour close above 3,215
Hold as support
Only then target: 3,430
📈 Without this → longs are counter-trend
We had a clear uptrend in the channel (black lines).
A breakout from the channel occurred at the bottom → this is a break of structure.
The decline was impulsive, without any major corrections → supply prevailed.
➡️ Medium-term bias: bearish/corrective
2️⃣ Key price levels
🔴 Supports
$2,938 – currently the closest technical support
$2,862 – a very important zone (strong reaction, long wick)
$2,740 – next HTF support (if the market collapses)
➡️ 2,862 = key decision level
Loss → high chance of a breakout to 2,740
🟢 Resistances
$3,081 – local resistance/flip after a breakout
$3,215 – former support, now resistance (ideal for shorts)
$3,430 – upper HTF resistance (only after a structure change)
3️⃣ Price Action (what we're seeing now)
After a strong dump, an impulsive downward wick appeared → Possible short-term relief (dead cat bounce).
The current bounce looks corrective, not impulsive.
Not yet:
higher low
4-hour candlestick closes above 3,081
➡️ This could still be just a pullback for further declines.
4️⃣ RSI Stochastic
RSI was heavily oversold → a technical bounce is normal.
Now a quick return to the upper regions → watch out for a bearish cross.
In downtrends, the Stoch RSI often:
Quickly reaches 80–100
and immediately reverses
➡️ RSI does not yet confirm a trend change
5️⃣ Scenarios
🟡 Scenario A – correction and further decline (more likely)
Bounce to 3,080–3,215
Rejection
Return to 2,860 → 2,740
📉 Short setup:
Reaction below 3,080 / 3,215
Weak volume, pin bar / bearish engulfing
🟢 Scenario B – return to growth (less likely)
Conditions:
4-hour close above 3,215
Hold as support
Only then target: 3,430
📈 Without this → longs are counter-trend

Aviso legal
As informações e publicações não se destinam a ser, e não constituem, conselhos ou recomendações financeiras, de investimento, comerciais ou de outro tipo fornecidos ou endossados pela TradingView. Leia mais nos Termos de Uso.
Aviso legal
As informações e publicações não se destinam a ser, e não constituem, conselhos ou recomendações financeiras, de investimento, comerciais ou de outro tipo fornecidos ou endossados pela TradingView. Leia mais nos Termos de Uso.