
Technical Analysis:
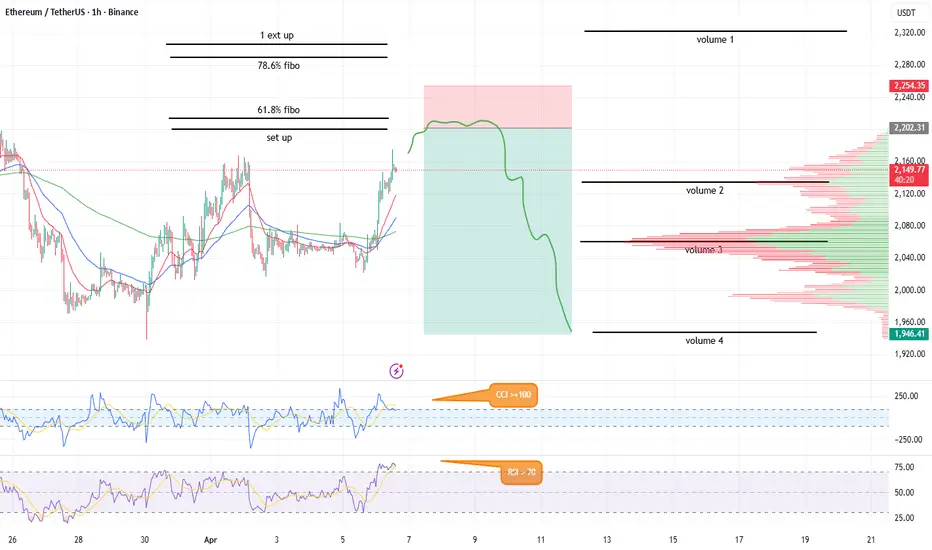
1️⃣СCI - above +100, a trade will require a move below +100
2️⃣RSI - above 70, a trade will require a move below 70
3️⃣Important Levels:
🔸The most important level is 2000 - 2200 - 61.8% Fibonacci + set up - this is a potential reversal area
🔸Volumes = 2134, 2064, and 1950 - potential problem points for a downward move and take profit.
4️⃣Larger TF (h4) - 200 EMA broken, CCI and RSI are also above the extreme range boundaries. The average will become a support for the price during a downward move.
5️⃣Price movement forecast - on the chart.
Entry, stop, take profit:
🔸Entry: On a breakout of the 2000-2200 zone
🔸Stop: No problem with the stop - nothing to hold on to. For now, 2236 is a very conditional peak. But I think the decline will be sharp, so a quick BUY is possible.
🔸Take Profit: TP based on increased volume 1 = 2152
🔸Risk/Reward: 4.92 for a volume of 1950
🔸Execution: Most likely by Thursday.
Cancelled
🔸Ceasefire on the BV
Fundamental:
1️⃣ Fear Index: 13 (Extreme Fear) → 🟢 Positive for ETH in the medium term.
We're afraid, waiting for a trigger for an upward move.
2️⃣ ETH/BTC: 0.0309 (Binance API) → 🟢 Positive for ETH.
Near multi-year lows. Significant mean reversion potential.
3️⃣ Funding Rate (ETH): +0.0062% (Binance API, April 6, 08:00 UTC) → ⚪ Neutral.
Slight positive. Slight upward shift in sentiment.
4️⃣ Open Interest (ETH): ~$24.2B total → ⚪ Neutral.
Moderate level. Traders aren't using much leverage for now.
5️⃣ Liquidations: >$250M in 24 hours (April 5), mostly shorts → 🟢 Positive for ETH.
There's still some momentum for an upward movement.
6️⃣ ETH ETF Flows: +$71M (April 4) → ⚪ Neutral.
There were inflows on April 4, but the trend is unsustainable. Fresh data will be released tomorrow.
7️⃣ Exchange Net Flow: 7,981K inflows on April 6 → ⚪ Neutral.
Inflows and outflows are small and offset each other.
8️⃣ Staking Rate: ~31-33% of supply (37.25M ETH) → 🟢 Positive for ETH.
A third of the supply is locked.
9️⃣MVRV (ETH): 0.87-0.93 → 🟢 Positive for ETH. The most significant positive.
Below 1.0 = the average holder is losing money. Potential boost for a reversal.
🔟Whale/Top Holders: 4.3M ETH in wallets with 100K+ ETH → 🟢 Positive for ETH.
Whales were actively buying on April 2nd; the number of whale transactions jumped from ~120 to 2,000+ in 24 hours (x17) – large players were buying up the decline.
1️⃣1️⃣Geopolitics: Iran → 🔴 Negative for ETH. The most important factor.
The situation changes literally with every new article, whether about a ceasefire or new threats. While it's growing on rumors of a 45-day truce, what's actually happening is unclear. And this is the most dangerous factor influencing the price.
Conclusion: 👈🏻 Positive for ETH in the medium term. The war in Iran is putting pressure on us in the short term.
1️⃣СCI - above +100, a trade will require a move below +100
2️⃣RSI - above 70, a trade will require a move below 70
3️⃣Important Levels:
🔸The most important level is 2000 - 2200 - 61.8% Fibonacci + set up - this is a potential reversal area
🔸Volumes = 2134, 2064, and 1950 - potential problem points for a downward move and take profit.
4️⃣Larger TF (h4) - 200 EMA broken, CCI and RSI are also above the extreme range boundaries. The average will become a support for the price during a downward move.
5️⃣Price movement forecast - on the chart.
Entry, stop, take profit:
🔸Entry: On a breakout of the 2000-2200 zone
🔸Stop: No problem with the stop - nothing to hold on to. For now, 2236 is a very conditional peak. But I think the decline will be sharp, so a quick BUY is possible.
🔸Take Profit: TP based on increased volume 1 = 2152
🔸Risk/Reward: 4.92 for a volume of 1950
🔸Execution: Most likely by Thursday.
Cancelled
🔸Ceasefire on the BV
Fundamental:
1️⃣ Fear Index: 13 (Extreme Fear) → 🟢 Positive for ETH in the medium term.
We're afraid, waiting for a trigger for an upward move.
2️⃣ ETH/BTC: 0.0309 (Binance API) → 🟢 Positive for ETH.
Near multi-year lows. Significant mean reversion potential.
3️⃣ Funding Rate (ETH): +0.0062% (Binance API, April 6, 08:00 UTC) → ⚪ Neutral.
Slight positive. Slight upward shift in sentiment.
4️⃣ Open Interest (ETH): ~$24.2B total → ⚪ Neutral.
Moderate level. Traders aren't using much leverage for now.
5️⃣ Liquidations: >$250M in 24 hours (April 5), mostly shorts → 🟢 Positive for ETH.
There's still some momentum for an upward movement.
6️⃣ ETH ETF Flows: +$71M (April 4) → ⚪ Neutral.
There were inflows on April 4, but the trend is unsustainable. Fresh data will be released tomorrow.
7️⃣ Exchange Net Flow: 7,981K inflows on April 6 → ⚪ Neutral.
Inflows and outflows are small and offset each other.
8️⃣ Staking Rate: ~31-33% of supply (37.25M ETH) → 🟢 Positive for ETH.
A third of the supply is locked.
9️⃣MVRV (ETH): 0.87-0.93 → 🟢 Positive for ETH. The most significant positive.
Below 1.0 = the average holder is losing money. Potential boost for a reversal.
🔟Whale/Top Holders: 4.3M ETH in wallets with 100K+ ETH → 🟢 Positive for ETH.
Whales were actively buying on April 2nd; the number of whale transactions jumped from ~120 to 2,000+ in 24 hours (x17) – large players were buying up the decline.
1️⃣1️⃣Geopolitics: Iran → 🔴 Negative for ETH. The most important factor.
The situation changes literally with every new article, whether about a ceasefire or new threats. While it's growing on rumors of a 45-day truce, what's actually happening is unclear. And this is the most dangerous factor influencing the price.
Conclusion: 👈🏻 Positive for ETH in the medium term. The war in Iran is putting pressure on us in the short term.

Publicações relacionadas
Aviso legal
As informações e publicações não se destinam a ser, e não constituem, conselhos ou recomendações financeiras, de investimento, comerciais ou de outro tipo fornecidos ou endossados pela TradingView. Leia mais nos Termos de Uso.
Publicações relacionadas
Aviso legal
As informações e publicações não se destinam a ser, e não constituem, conselhos ou recomendações financeiras, de investimento, comerciais ou de outro tipo fornecidos ou endossados pela TradingView. Leia mais nos Termos de Uso.