
As we move through May 2026, Ethereum (ETH) continues to navigate a complex macro landscape defined by stabilizing US Treasury yields and a neutral to dovish Fed posture. The broader Global Liquidity Cycle is currently in an expansionary phase, which historically favors high-beta assets like ETH. However, the current price action suggests a momentary pause as the market digests the recent impulse from the $1,800 liquidity sweep.
Global Liquidity refers to the total amount of money flowing through the global financial system. When liquidity expands, investors typically move out the risk curve into assets like Ethereum.
Liquidity Conditions, The Vacuum Above
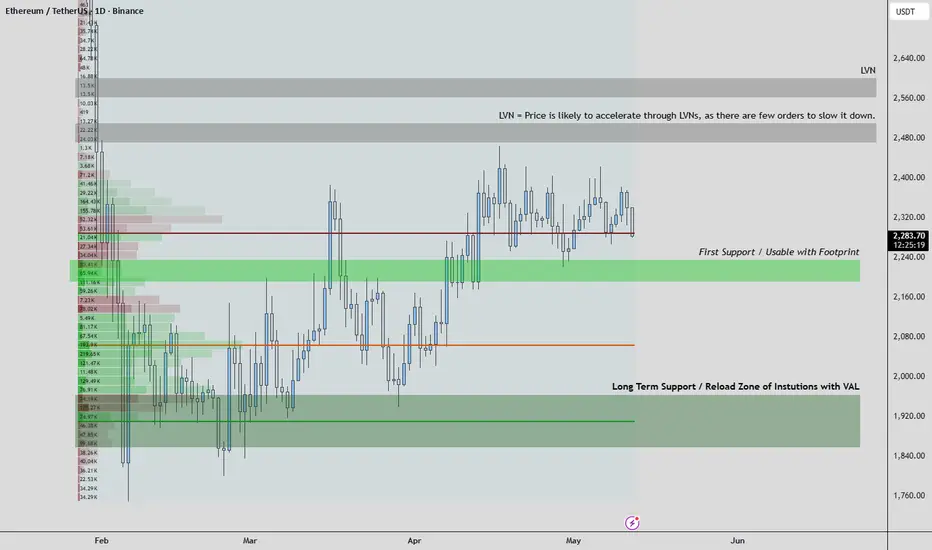
The chart highlights a critical Low Volume Node (LVN) between $2,471 and $2,509. This zone represents a liquidity vacuum. Because few transactions occurred here during the previous decline, there is a lack of resting sell orders to slow down an advancing price.
A Low Volume Node (LVN) is an area on the chart where very little trading has occurred. Think of it as a thin zone where price can move quickly due to limited historical friction.
Order Flow & Footprint Logic, Effort vs Result
The current consolidation near $2,283 shows classic passive absorption. High volumes of aggressive market sells are being met by institutional limit orders in the $2,200 to $2,240 support zone.
Passive absorption occurs when large limit buyers absorb aggressive selling pressure without allowing price to break lower. It acts like a structural bid wall.
Institutional Interpretation of Flow
Market Structure, Accumulation or Distribution
The structure remains bullishly biased as long as the $1,900 reload zone (Value Area Low) holds. The market is currently in a re-accumulation phase, shaking out weak participants before attempting expansion toward higher liquidity zones.
Institutional Interpretation & Sustainability
From an institutional perspective, the move remains structurally intact. The $1,900 to $1,950 region represents the Value Area Low, where accumulation is expected. The absence of a blow-off top suggests this advance is driven more by spot accumulation than excessive leverage.
Value Area Low (VAL) is the lower boundary of the main volume distribution, where roughly 70 percent of trading activity occurred. Institutions often view this zone as fair value or discount territory.
Key Invalidation Levels & Catalysts
Conclusion
Ethereum is currently in a consolidation phase within a broader bullish structure. Effort versus result analysis suggests that as long as the $2,200 zone continues to absorb selling pressure, the path of least resistance remains upward toward the LVN cluster near $2,500. This is a market driven by patience, liquidity, and structural positioning rather than impulsive directionality.
Global Liquidity refers to the total amount of money flowing through the global financial system. When liquidity expands, investors typically move out the risk curve into assets like Ethereum.
- DXY & Real Yields: The US Dollar Index (DXY) is exhibiting signs of distribution at local highs. Any sustained weakness here will likely act as a tailwind for ETH/USDT.
- ETF Dynamics: Institutional sticky capital via spot ETFs has created a higher floor for ETH, reducing drawdown volatility compared to previous cycles.
- Correlated Assets: ETH is currently showing a high positive correlation with the Nasdaq (IXIC), reflecting its status as a technology proxy within institutional portfolios.
Liquidity Conditions, The Vacuum Above
The chart highlights a critical Low Volume Node (LVN) between $2,471 and $2,509. This zone represents a liquidity vacuum. Because few transactions occurred here during the previous decline, there is a lack of resting sell orders to slow down an advancing price.
A Low Volume Node (LVN) is an area on the chart where very little trading has occurred. Think of it as a thin zone where price can move quickly due to limited historical friction.
- The Sweep: The blue circle at the bottom near $1,720 marks a major liquidity hunt. This was the fuel for the current move, capturing sell stops and enabling institutional long positioning.
- The Value Area: Price is currently pivoting around the Point of Control (POC) near $2,310. This is the fair value zone where the most volume has been traded.
Order Flow & Footprint Logic, Effort vs Result
The current consolidation near $2,283 shows classic passive absorption. High volumes of aggressive market sells are being met by institutional limit orders in the $2,200 to $2,240 support zone.
Passive absorption occurs when large limit buyers absorb aggressive selling pressure without allowing price to break lower. It acts like a structural bid wall.
Institutional Interpretation of Flow
- Effort vs Result: If we observe strong negative delta (aggressive selling) but price fails to break below $2,200, it indicates smart money is absorbing supply.
- Failed Auction: The repeated taps into the $2,400 region without continuation suggest buyer exhaustion and controlled rotation back toward equilibrium (POC).
Market Structure, Accumulation or Distribution
The structure remains bullishly biased as long as the $1,900 reload zone (Value Area Low) holds. The market is currently in a re-accumulation phase, shaking out weak participants before attempting expansion toward higher liquidity zones.
- Targeting External Liquidity: Primary objective is the liquidity resting above $2,440 highs.
- Internal Liquidity: The current retracement is targeting inefficiencies left behind during the prior impulsive move.
Institutional Interpretation & Sustainability
From an institutional perspective, the move remains structurally intact. The $1,900 to $1,950 region represents the Value Area Low, where accumulation is expected. The absence of a blow-off top suggests this advance is driven more by spot accumulation than excessive leverage.
Value Area Low (VAL) is the lower boundary of the main volume distribution, where roughly 70 percent of trading activity occurred. Institutions often view this zone as fair value or discount territory.
Key Invalidation Levels & Catalysts
- Bullish Confirmation: Daily close above $2,350 with expanding positive delta.
- Bearish Invalidation: Sustained loss of $2,200, which would shift focus toward the $1,900 reload zone.
- Upcoming Catalysts: CPI print and ETH ETF inflow data. A softer inflation reading could act as a catalyst for breakout through $2,500 liquidity.
Conclusion
Ethereum is currently in a consolidation phase within a broader bullish structure. Effort versus result analysis suggests that as long as the $2,200 zone continues to absorb selling pressure, the path of least resistance remains upward toward the LVN cluster near $2,500. This is a market driven by patience, liquidity, and structural positioning rather than impulsive directionality.

Aviso legal
As informações e publicações não se destinam a ser, e não constituem, conselhos ou recomendações financeiras, de investimento, comerciais ou de outro tipo fornecidos ou endossados pela TradingView. Leia mais nos Termos de Uso.
Aviso legal
As informações e publicações não se destinam a ser, e não constituem, conselhos ou recomendações financeiras, de investimento, comerciais ou de outro tipo fornecidos ou endossados pela TradingView. Leia mais nos Termos de Uso.