Short
ETP/USD DAILY CHART bearish signals
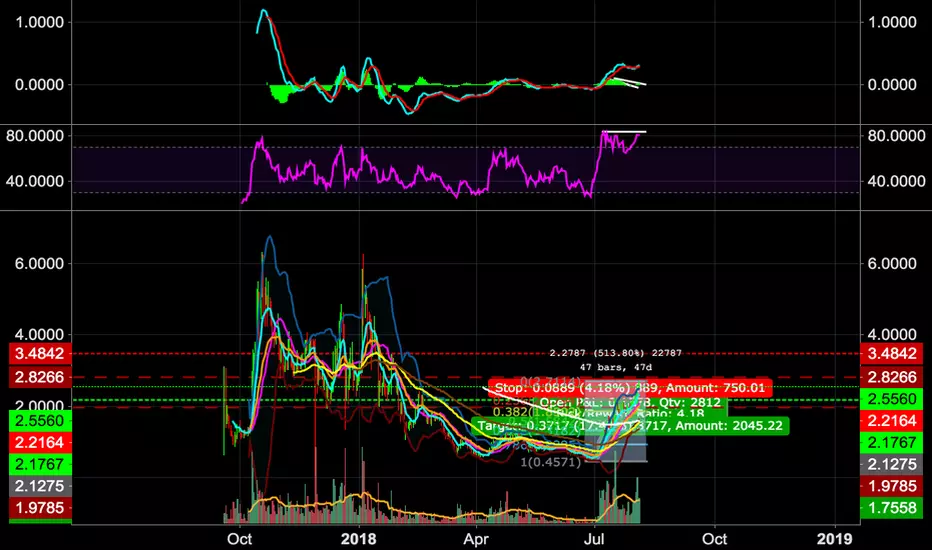
after an increase in price of more than 513% in 41 days with high volume ETP is most likely to retrace very soon.
MACD is really high and forms bearish divergences in the histogram. In addition RSI is performing bearish divergences too and is in the overbought zone for quite a long time.
Strong bearish signals. Daily chart. Nevertheless I see a possible rise to 2.833 USD before the retracement starts as the is the 6.18 fib level.
MACD is really high and forms bearish divergences in the histogram. In addition RSI is performing bearish divergences too and is in the overbought zone for quite a long time.
Strong bearish signals. Daily chart. Nevertheless I see a possible rise to 2.833 USD before the retracement starts as the is the 6.18 fib level.
Nota
as there is the 6.18 fib level.*
Aviso legal
As informações e publicações não se destinam a ser, e não constituem, conselhos ou recomendações financeiras, de investimento, comerciais ou de outro tipo fornecidos ou endossados pela TradingView. Leia mais nos Termos de Uso.
Aviso legal
As informações e publicações não se destinam a ser, e não constituem, conselhos ou recomendações financeiras, de investimento, comerciais ou de outro tipo fornecidos ou endossados pela TradingView. Leia mais nos Termos de Uso.