

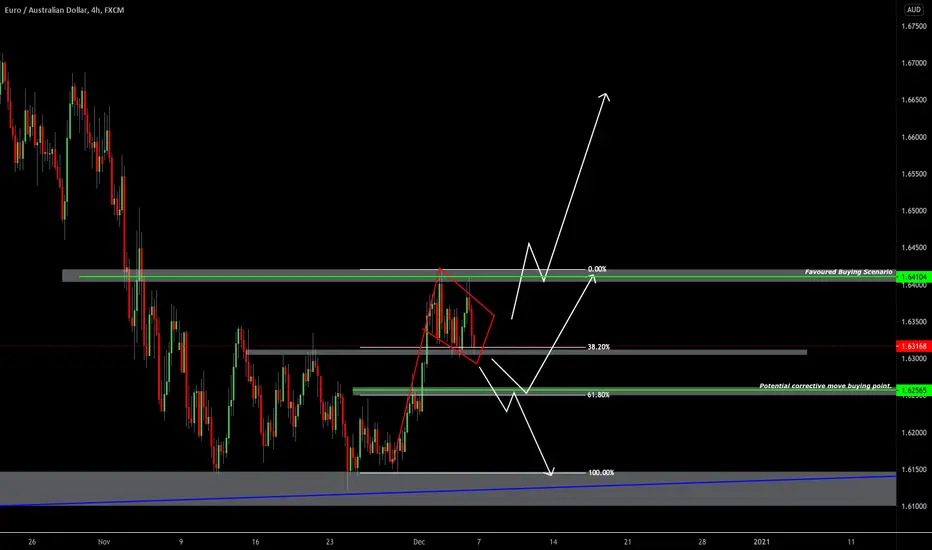
Don't be put off by all the charting, let me break it down.
Firstly what can we see?
The blue line is a weekly trend line dating back years which as you can see, isn't breaking.
This is followed up by the daily support in grey.
In red, we have a Bullish Flag pattern. Buys on the break of the high of the flag is favoured with clean traffic.
Alternatively, we could see the usual correction to 61.8% fib as highlighted before another push.
3rd scenario is we retest that bottom support but unlikely.
Firstly what can we see?
The blue line is a weekly trend line dating back years which as you can see, isn't breaking.
This is followed up by the daily support in grey.
In red, we have a Bullish Flag pattern. Buys on the break of the high of the flag is favoured with clean traffic.
Alternatively, we could see the usual correction to 61.8% fib as highlighted before another push.
3rd scenario is we retest that bottom support but unlikely.

Aviso legal
As informações e publicações não se destinam a ser, e não constituem, conselhos ou recomendações financeiras, de investimento, comerciais ou de outro tipo fornecidos ou endossados pela TradingView. Leia mais nos Termos de Uso.
Aviso legal
As informações e publicações não se destinam a ser, e não constituem, conselhos ou recomendações financeiras, de investimento, comerciais ou de outro tipo fornecidos ou endossados pela TradingView. Leia mais nos Termos de Uso.