

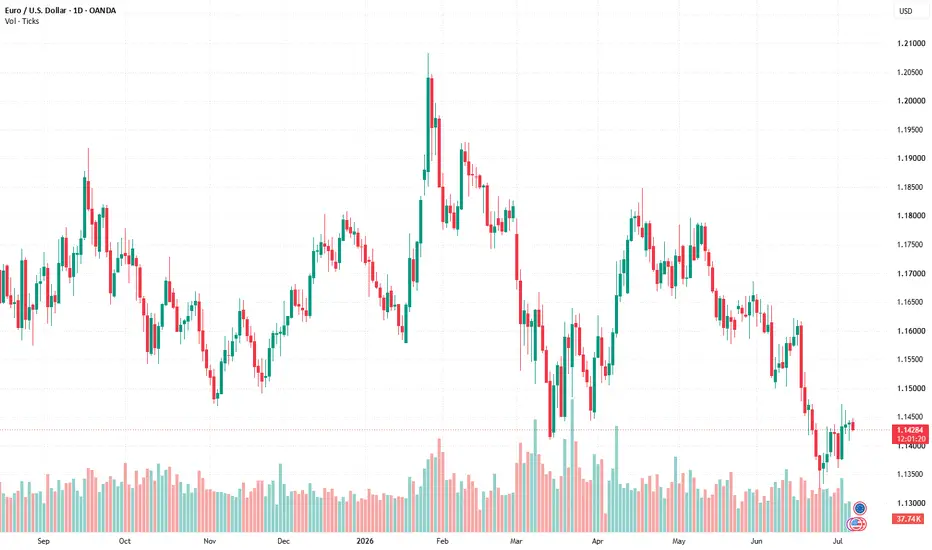
Learning finance can feel confusing at first, especially when many financial terms sound similar. For beginners, understanding the right meaning of common market words can make financial news, charts, and educational content much easier to follow.
Below are some financial terms beginners often confuse.
Price vs Value
Price is the current market amount of an asset. It can change quickly based on demand, news, and market sentiment.
Value is a broader idea. It looks at what an asset may be worth based on usefulness, strength, demand, or long term relevance.
Volatility vs Risk
Volatility means how fast and how much prices move.
Risk means the chance of an unwanted result. Volatility can be part of risk, but risk also includes poor planning, lack of information, and unexpected events.
Bull Market vs Bear Market
A bull market means prices are generally rising and confidence is stronger.
A bear market means prices are generally falling and market sentiment is more cautious.
These terms usually describe wider market conditions, not just one short price move.
Correction vs Crash
A correction is a normal decline after a period of growth.
A crash is a faster and sharper drop that usually creates more fear in the market.
Both describe falling prices, but the size and speed are different.
Support vs Resistance
Support is a lower price area where demand may slow a decline.
Resistance is an upper price area where pressure may slow an increase.
These are basic chart terms often used in market education.
Volume vs Liquidity
Volume shows how much market activity happened during a certain time.
Liquidity shows how easily an asset can be bought or sold without a major price change.
High volume can support liquidity, but they are not the same thing.
Market Cap vs Price
Price shows the cost of one unit.
Market cap shows the total estimated market value. It is usually calculated by multiplying price by total supply.
This is why a low price does not always mean something is cheap.
Fundamental Analysis vs Technical Analysis
Fundamental analysis studies wider factors like economic data, company performance, and industry trends.
Technical analysis studies charts, price movement, volume, and patterns.
Both are common ways to understand financial markets.
Stablecoin vs Cryptocurrency
A cryptocurrency is a digital asset built with blockchain technology.
A stablecoin is a type of cryptocurrency designed to keep a more stable value, often linked to a regular currency like the US dollar.
Final Thoughts
Understanding common financial terms is an important step for beginners. Clear language helps people read market updates, follow financial education content, and understand basic concepts with more confidence.
Learning finance does not need to happen all at once. Start with simple terms, compare similar ideas, and build knowledge step by step.
Below are some financial terms beginners often confuse.
Price vs Value
Price is the current market amount of an asset. It can change quickly based on demand, news, and market sentiment.
Value is a broader idea. It looks at what an asset may be worth based on usefulness, strength, demand, or long term relevance.
Volatility vs Risk
Volatility means how fast and how much prices move.
Risk means the chance of an unwanted result. Volatility can be part of risk, but risk also includes poor planning, lack of information, and unexpected events.
Bull Market vs Bear Market
A bull market means prices are generally rising and confidence is stronger.
A bear market means prices are generally falling and market sentiment is more cautious.
These terms usually describe wider market conditions, not just one short price move.
Correction vs Crash
A correction is a normal decline after a period of growth.
A crash is a faster and sharper drop that usually creates more fear in the market.
Both describe falling prices, but the size and speed are different.
Support vs Resistance
Support is a lower price area where demand may slow a decline.
Resistance is an upper price area where pressure may slow an increase.
These are basic chart terms often used in market education.
Volume vs Liquidity
Volume shows how much market activity happened during a certain time.
Liquidity shows how easily an asset can be bought or sold without a major price change.
High volume can support liquidity, but they are not the same thing.
Market Cap vs Price
Price shows the cost of one unit.
Market cap shows the total estimated market value. It is usually calculated by multiplying price by total supply.
This is why a low price does not always mean something is cheap.
Fundamental Analysis vs Technical Analysis
Fundamental analysis studies wider factors like economic data, company performance, and industry trends.
Technical analysis studies charts, price movement, volume, and patterns.
Both are common ways to understand financial markets.
Stablecoin vs Cryptocurrency
A cryptocurrency is a digital asset built with blockchain technology.
A stablecoin is a type of cryptocurrency designed to keep a more stable value, often linked to a regular currency like the US dollar.
Final Thoughts
Understanding common financial terms is an important step for beginners. Clear language helps people read market updates, follow financial education content, and understand basic concepts with more confidence.
Learning finance does not need to happen all at once. Start with simple terms, compare similar ideas, and build knowledge step by step.

Aviso legal
As informações e publicações não se destinam a ser, e não constituem, conselhos ou recomendações financeiras, de investimento, comerciais ou de outro tipo fornecidos ou endossados pela TradingView. Leia mais nos Termos de Uso.
Aviso legal
As informações e publicações não se destinam a ser, e não constituem, conselhos ou recomendações financeiras, de investimento, comerciais ou de outro tipo fornecidos ou endossados pela TradingView. Leia mais nos Termos de Uso.