Long
ExideInd1!
27-11
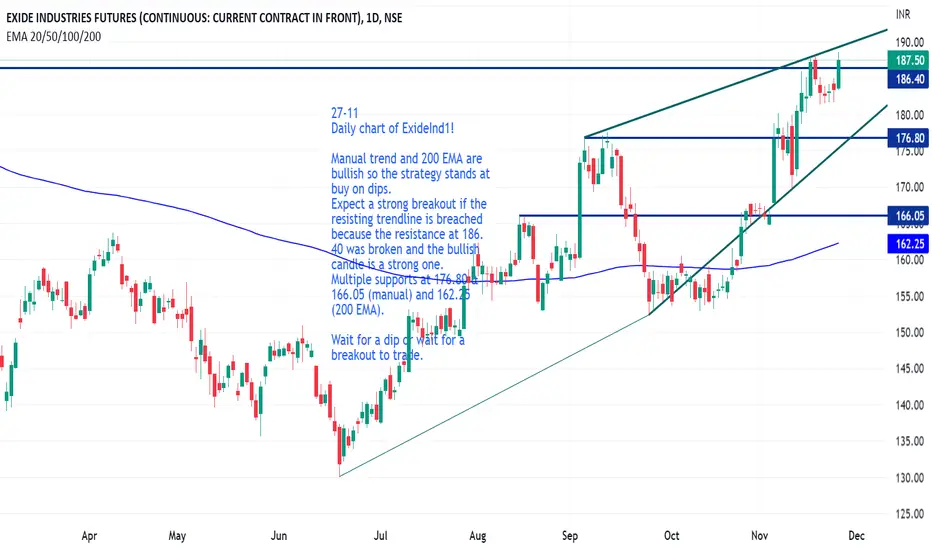
Daily chart of ExideInd1!
Manual trend and 200 EMA are bullish so the strategy stands at buy on dips.
Expect a strong breakout if the resisting trendline is breached because the resistance at 186.40 was broken and the bullish candle is a strong one.
Multiple supports at 176.80 & 166.05 (manual) and 162.25 (200 EMA).
Wait for a dip or wait for a breakout to trade.
Daily chart of ExideInd1!
Manual trend and 200 EMA are bullish so the strategy stands at buy on dips.
Expect a strong breakout if the resisting trendline is breached because the resistance at 186.40 was broken and the bullish candle is a strong one.
Multiple supports at 176.80 & 166.05 (manual) and 162.25 (200 EMA).
Wait for a dip or wait for a breakout to trade.

Aviso legal
As informações e publicações não se destinam a ser, e não constituem, conselhos ou recomendações financeiras, de investimento, comerciais ou de outro tipo fornecidos ou endossados pela TradingView. Leia mais nos Termos de Uso.
Aviso legal
As informações e publicações não se destinam a ser, e não constituem, conselhos ou recomendações financeiras, de investimento, comerciais ou de outro tipo fornecidos ou endossados pela TradingView. Leia mais nos Termos de Uso.