Long
Facebook (FB)
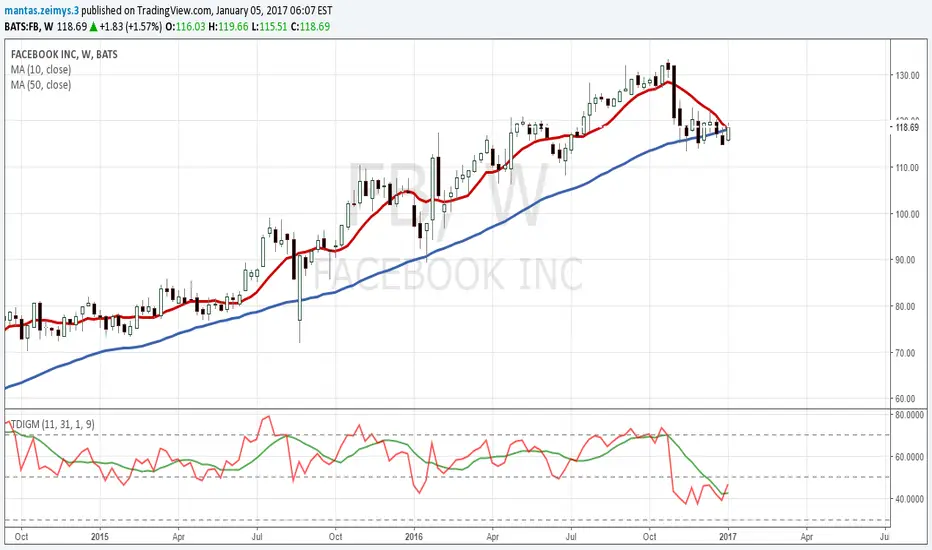
Timeframe: W1
Indicator:
10SMA - Entry point
50SMA - Check trend (If price under 50SMA(Bearish trend) , if above 50SMA(Bullish trend and we looking for buy)
TRADER DINAMIC INDEX (Green/Red) - Check entry/exit point as well
In a chart price is above 50SMA, so we looking for buy signals
TRADER DINAMIC INDEX red line cross green line from bottom.
When price cross 10SMA we need to buy. STOP LOSS 3% / TAKE PROFIT 10%
If price no touch take profit and TRADER DINAMIC INDEX cross from above need close position with profit or loss.
Indicator:
10SMA - Entry point
50SMA - Check trend (If price under 50SMA(Bearish trend) , if above 50SMA(Bullish trend and we looking for buy)
TRADER DINAMIC INDEX (Green/Red) - Check entry/exit point as well
In a chart price is above 50SMA, so we looking for buy signals
TRADER DINAMIC INDEX red line cross green line from bottom.
When price cross 10SMA we need to buy. STOP LOSS 3% / TAKE PROFIT 10%
If price no touch take profit and TRADER DINAMIC INDEX cross from above need close position with profit or loss.

Aviso legal
As informações e publicações não se destinam a ser, e não constituem, conselhos ou recomendações financeiras, de investimento, comerciais ou de outro tipo fornecidos ou endossados pela TradingView. Leia mais nos Termos de Uso.
Aviso legal
As informações e publicações não se destinam a ser, e não constituem, conselhos ou recomendações financeiras, de investimento, comerciais ou de outro tipo fornecidos ou endossados pela TradingView. Leia mais nos Termos de Uso.