Long
Long FB
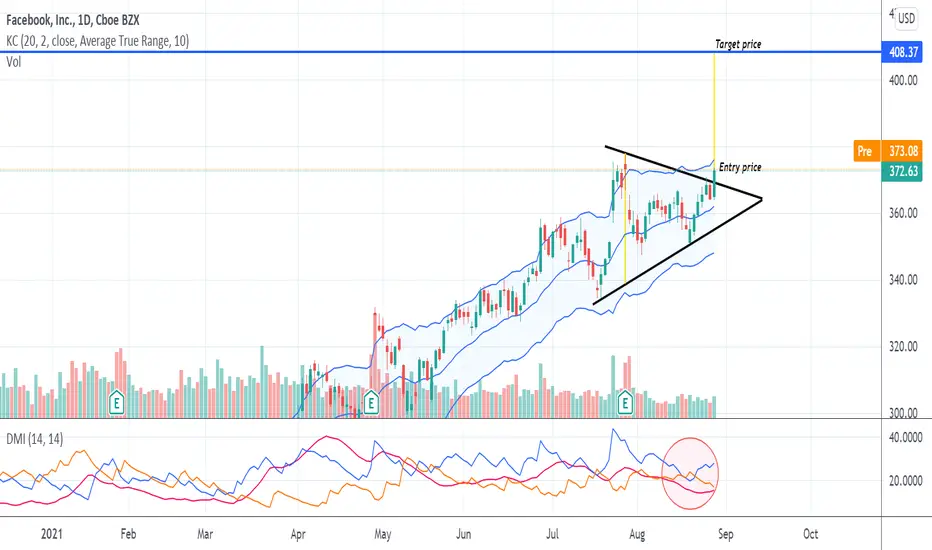
Entry price: 369-375$
Target price: 408$
Stop loss: 365-369$
Keltner Channel: the price is inside of the channel, approaching the upper boundary.
Chart pattern: symmetrical triangle
DMI: +DI line crossed -DI line from the below. Moreover, the intersection moment appeared above the ADX line what might suggest the bullish momentum of the price.
Conclusions: The price broke the upper boundary of the triangle pattern, however there is no volume increase at the moment. Thus, long position is recommended after the price correction above the pattern with the entry price on the new support level.

💥 Free signals and ideas ➡ t.me/vfinvestment
Aviso legal
As informações e publicações não se destinam a ser, e não constituem, conselhos ou recomendações financeiras, de investimento, comerciais ou de outro tipo fornecidos ou endossados pela TradingView. Leia mais nos Termos de Uso.
💥 Free signals and ideas ➡ t.me/vfinvestment
Aviso legal
As informações e publicações não se destinam a ser, e não constituem, conselhos ou recomendações financeiras, de investimento, comerciais ou de outro tipo fornecidos ou endossados pela TradingView. Leia mais nos Termos de Uso.