
The FET symbol exploded by more than 900% in the previous months and then entered a correction.
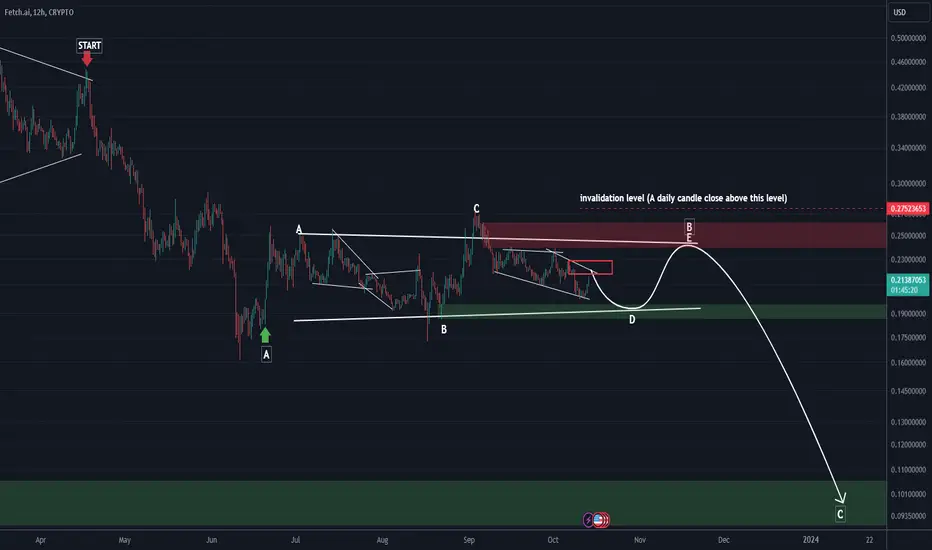
Where I wrote "START" on the chart is where the FET symbol entered the corrective phase.
In the corrective phase The FET symbol, after completing a bearish wave (wave A), is now oscillating in a neutral range, appearing to be completing a large bearish triangle. After the completion of waves D and E, the FET symbol enters a large bearish wave C.
I marked the invalidation level on the chart. Closing a daily candle above this level will violate the analysis.
For risk management, please don't forget stop loss and capital management
Comment if you have any questions
Thank You
Where I wrote "START" on the chart is where the FET symbol entered the corrective phase.
In the corrective phase The FET symbol, after completing a bearish wave (wave A), is now oscillating in a neutral range, appearing to be completing a large bearish triangle. After the completion of waves D and E, the FET symbol enters a large bearish wave C.
I marked the invalidation level on the chart. Closing a daily candle above this level will violate the analysis.
For risk management, please don't forget stop loss and capital management
Comment if you have any questions
Thank You

✅ Join our Telegram channel to succeed in crypto trading.
💎Our CRYPTO Telegram Channel: 👉 t.me/Behdark_EN
💎Our FOREX Telegram Channel: 👉 t.me/FX_Behdark
💎Our CRYPTO Telegram Channel: 👉 t.me/Behdark_EN
💎Our FOREX Telegram Channel: 👉 t.me/FX_Behdark
Aviso legal
As informações e publicações não se destinam a ser, e não constituem, conselhos ou recomendações financeiras, de investimento, comerciais ou de outro tipo fornecidos ou endossados pela TradingView. Leia mais nos Termos de Uso.
✅ Join our Telegram channel to succeed in crypto trading.
💎Our CRYPTO Telegram Channel: 👉 t.me/Behdark_EN
💎Our FOREX Telegram Channel: 👉 t.me/FX_Behdark
💎Our CRYPTO Telegram Channel: 👉 t.me/Behdark_EN
💎Our FOREX Telegram Channel: 👉 t.me/FX_Behdark
Aviso legal
As informações e publicações não se destinam a ser, e não constituem, conselhos ou recomendações financeiras, de investimento, comerciais ou de outro tipo fornecidos ou endossados pela TradingView. Leia mais nos Termos de Uso.