
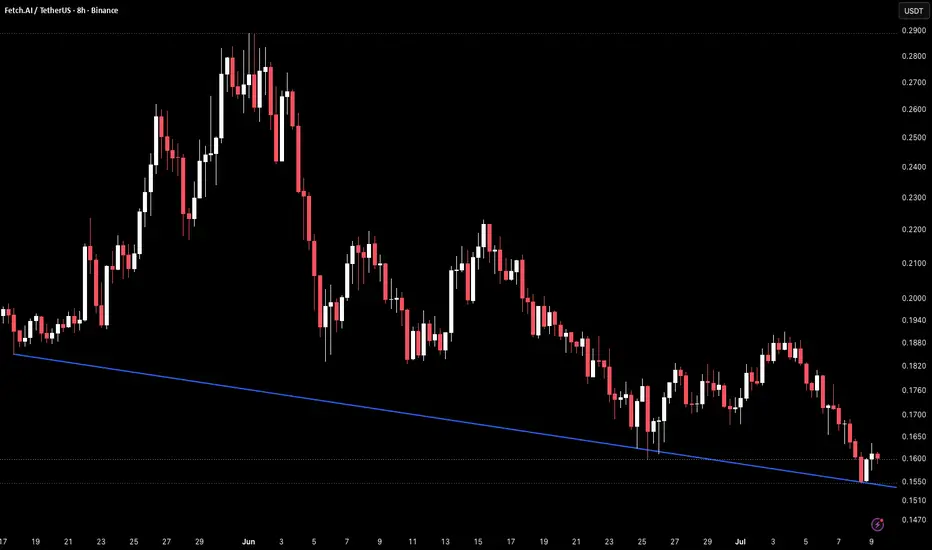
FET on the 8H timeframe is currently trading around 0.1969 after a sustained decline from the late May high near 0.2900, with price now compressing between a descending trendline from above and a horizontal support level near 0.1550–0.1600 that has held as a floor through the entire post-spike structure.
The chart shows price spiking from the mid-May range near 0.1880–0.1900 up to a high near 0.2900 in late May before sellers took over and pushed price back through the spike base and into a steady grind lower. A descending trendline connects the late May high through the mid-June recovery high near 0.2200 and the late June high near 0.1880, sloping down into the 0.1650–0.1700 area currently. The horizontal level near 0.1550–0.1600 has acted as a consistent floor since the spike, catching the June 25 low near 0.1610 and again the early July low near 0.1550 before price recovered briefly each time. The descending trendline has capped every recovery attempt without exception, leaving price in a progressively tighter range between the two levels.
Price is now sitting just above the 0.1550–0.1600 horizontal support with the descending trendline overhead near 0.1650–0.1700, leaving almost no room before one of the two levels gives way.
Key Levels To Watch
→ 0.2800–0.2900 – May spike high, major resistance above
→ 0.2100–0.2200 – Prior recovery high, resistance
→ 0.1880–0.1900 – Spike base and prior support, now resistance
→ 0.1650–0.1700 – Descending trendline, current overhead resistance (dynamic)
→ 0.1550–0.1600 – Horizontal support, current test
→ 0.1470–0.1510 – Next support below on breakdown
→ Below 0.1400 – Extended breakdown territory
A hold at the 0.1550–0.1600 horizontal support and a break above the descending trendline near 0.1650–0.1700 would signal a structural shift, opening a recovery toward 0.1880–0.1900 and potentially 0.2100–0.2200 on continuation.
A confirmed 8H close below the 0.1550 horizontal support would remove the floor that has held since the May spike, with the descending trendline continuing to suppress any recovery and exposing price to a move toward 0.1470–0.1510 and below.
Price compressed between descending trendline and horizontal support, resolution imminent. Hold 0.1550–0.1600 and break trendline → recovery open toward 0.1880–0.1900. Lose 0.1550 → floor gone, downside toward 0.1470–0.1510. Bias bearish below descending trendline. Shift only on confirmed trendline break with reclaim of 0.1650–0.1700.
The chart shows price spiking from the mid-May range near 0.1880–0.1900 up to a high near 0.2900 in late May before sellers took over and pushed price back through the spike base and into a steady grind lower. A descending trendline connects the late May high through the mid-June recovery high near 0.2200 and the late June high near 0.1880, sloping down into the 0.1650–0.1700 area currently. The horizontal level near 0.1550–0.1600 has acted as a consistent floor since the spike, catching the June 25 low near 0.1610 and again the early July low near 0.1550 before price recovered briefly each time. The descending trendline has capped every recovery attempt without exception, leaving price in a progressively tighter range between the two levels.
Price is now sitting just above the 0.1550–0.1600 horizontal support with the descending trendline overhead near 0.1650–0.1700, leaving almost no room before one of the two levels gives way.
Key Levels To Watch
→ 0.2800–0.2900 – May spike high, major resistance above
→ 0.2100–0.2200 – Prior recovery high, resistance
→ 0.1880–0.1900 – Spike base and prior support, now resistance
→ 0.1650–0.1700 – Descending trendline, current overhead resistance (dynamic)
→ 0.1550–0.1600 – Horizontal support, current test
→ 0.1470–0.1510 – Next support below on breakdown
→ Below 0.1400 – Extended breakdown territory
A hold at the 0.1550–0.1600 horizontal support and a break above the descending trendline near 0.1650–0.1700 would signal a structural shift, opening a recovery toward 0.1880–0.1900 and potentially 0.2100–0.2200 on continuation.
A confirmed 8H close below the 0.1550 horizontal support would remove the floor that has held since the May spike, with the descending trendline continuing to suppress any recovery and exposing price to a move toward 0.1470–0.1510 and below.
Price compressed between descending trendline and horizontal support, resolution imminent. Hold 0.1550–0.1600 and break trendline → recovery open toward 0.1880–0.1900. Lose 0.1550 → floor gone, downside toward 0.1470–0.1510. Bias bearish below descending trendline. Shift only on confirmed trendline break with reclaim of 0.1650–0.1700.

Aviso legal
As informações e publicações não se destinam a ser, e não constituem, conselhos ou recomendações financeiras, de investimento, comerciais ou de outro tipo fornecidos ou endossados pela TradingView. Leia mais nos Termos de Uso.
Aviso legal
As informações e publicações não se destinam a ser, e não constituem, conselhos ou recomendações financeiras, de investimento, comerciais ou de outro tipo fornecidos ou endossados pela TradingView. Leia mais nos Termos de Uso.