
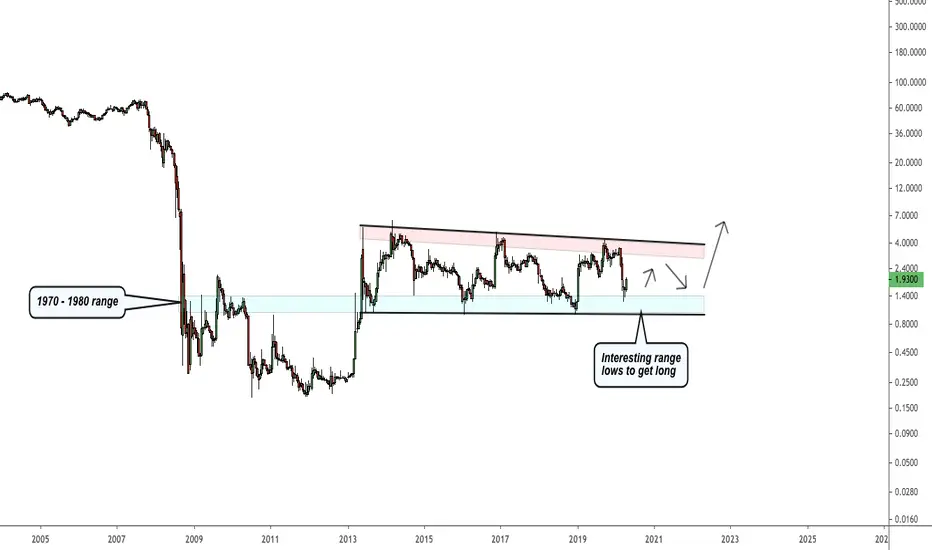
Fannie Mae is setting up to be an interesting rectangular chart pattern. At some point FNMA will breakout and it'll be a high probability trade. Until then, the range lows offer an interesting long set-up with targets at the top of the range. This could take 2-5 years before breaking out (or less/more). From 1970 - 1986, FNMA did nothing except trade in a range before finally breaking out. Just a good one to keep an eye on, potentially a good indicator for the broader market as well - everytime Fannie Mae hit the lows of the range the broader market was a great buy.
Percentage increase from the lows of the range generated a strong average return since 2013

Percentage increase from the lows of the range generated a strong average return since 2013

Aviso legal
As informações e publicações não se destinam a ser, e não constituem, conselhos ou recomendações financeiras, de investimento, comerciais ou de outro tipo fornecidos ou endossados pela TradingView. Leia mais nos Termos de Uso.
Aviso legal
As informações e publicações não se destinam a ser, e não constituem, conselhos ou recomendações financeiras, de investimento, comerciais ou de outro tipo fornecidos ou endossados pela TradingView. Leia mais nos Termos de Uso.