Fantom (FTM) - September 5
Hello?
Welcome, traders.
By "following", you can always get new information quickly.
Please also click "Like".
Have a good day.
-------------------------------------
(FTMUSDT 1W chart)

Whether or not it can move higher than 0.3661 is crucial.
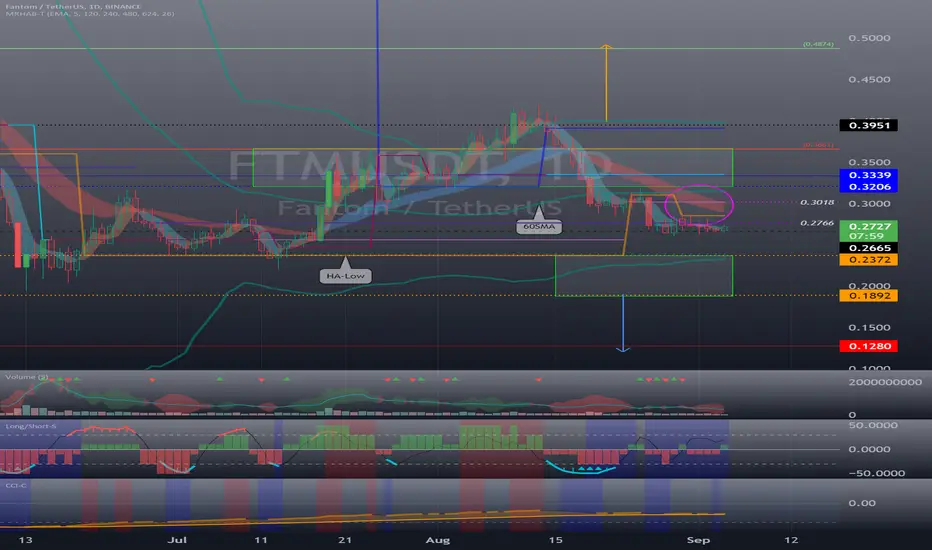
(1D chart)
Resistance: 0.3206-0.3661
Support: 0.1892-0.2372
In order to turn into an uptrend, it must rise above the HA-Low indicator.
So, we need to see if we can rise above 0.3018.
------------------------------------------------------------ -----------------------------------------------------
** All descriptions are for reference only and do not guarantee a profit or loss in investment.
** The MRHAB-T indicator, which is inactive on the chart, contains indicators that indicate support and resistance points.
** Background color of Long/Short-S indicator: RSI oversold and overbought sections
** Background color of CCI-C indicator: When the short-term CCI line is below -100 and above +100, oversold and overbought sections are displayed.
** The OBV indicator was re-created by applying a formula to the DepthHouse Trading indicator, an indicator disclosed by oh92. (Thanks for this.)
(Short-term Stop Loss can be said to be a point where profit and loss can be preserved or additional entry can be made through split trading. It is a short-term investment perspective.)
---------------------------------
Welcome, traders.
By "following", you can always get new information quickly.
Please also click "Like".
Have a good day.
-------------------------------------
(FTMUSDT 1W chart)
Whether or not it can move higher than 0.3661 is crucial.
(1D chart)
Resistance: 0.3206-0.3661
Support: 0.1892-0.2372
In order to turn into an uptrend, it must rise above the HA-Low indicator.
So, we need to see if we can rise above 0.3018.
------------------------------------------------------------ -----------------------------------------------------
** All descriptions are for reference only and do not guarantee a profit or loss in investment.
** The MRHAB-T indicator, which is inactive on the chart, contains indicators that indicate support and resistance points.
** Background color of Long/Short-S indicator: RSI oversold and overbought sections
** Background color of CCI-C indicator: When the short-term CCI line is below -100 and above +100, oversold and overbought sections are displayed.
** The OBV indicator was re-created by applying a formula to the DepthHouse Trading indicator, an indicator disclosed by oh92. (Thanks for this.)
(Short-term Stop Loss can be said to be a point where profit and loss can be preserved or additional entry can be made through split trading. It is a short-term investment perspective.)
---------------------------------

[Practical trading strategy using HA-MS and SBOD]
youtu.be/aceN1AttX1Y
[Web Site]
readcrypto.kr
- Chart pattern analysis has been added.
youtu.be/aceN1AttX1Y
[Web Site]
readcrypto.kr
- Chart pattern analysis has been added.
Publicações relacionadas
Aviso legal
As informações e publicações não se destinam a ser, e não constituem, conselhos ou recomendações financeiras, de investimento, comerciais ou de outro tipo fornecidos ou endossados pela TradingView. Leia mais nos Termos de Uso.
[Practical trading strategy using HA-MS and SBOD]
youtu.be/aceN1AttX1Y
[Web Site]
readcrypto.kr
- Chart pattern analysis has been added.
youtu.be/aceN1AttX1Y
[Web Site]
readcrypto.kr
- Chart pattern analysis has been added.
Publicações relacionadas
Aviso legal
As informações e publicações não se destinam a ser, e não constituem, conselhos ou recomendações financeiras, de investimento, comerciais ou de outro tipo fornecidos ou endossados pela TradingView. Leia mais nos Termos de Uso.