

1. Chart Pattern
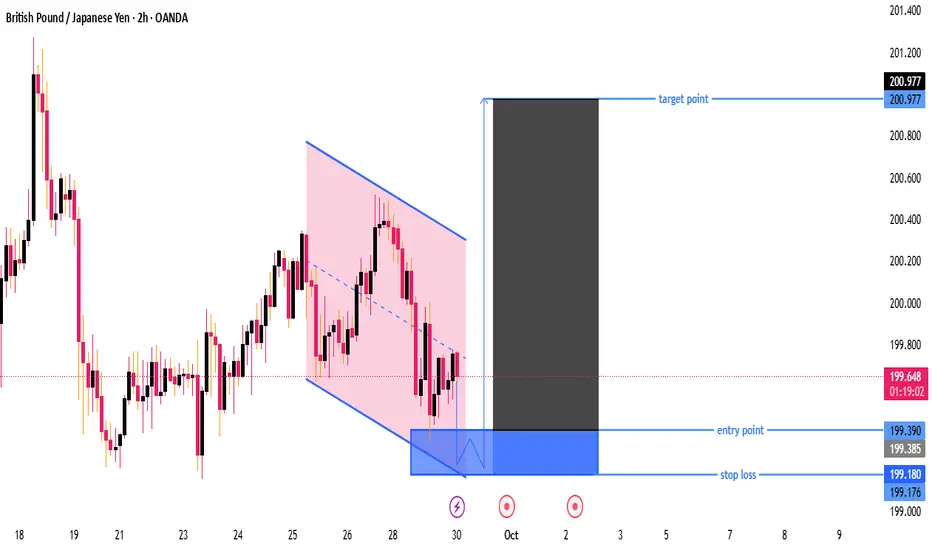
Price is moving inside a descending channel (highlighted in pink).
Currently, price is near the lower boundary of the channel, suggesting possible support.
2. Entry, Stop Loss & Target
Entry Point: Around 199.390
This is placed slightly above the lower support of the channel, anticipating a bounce.
Stop Loss: Around 199.180
This is just below the support zone, keeping risk tight.
If price drops below this, it means the bullish idea is invalidated.
Target Point: Around 200.977
This is close to the upper range of the recent price action, giving a good risk-to-reward ratio.
3. Trade Idea
This setup is a buy (long) position plan:
Reasoning: Buying near support of the descending channel, expecting price to break out upwards.
Risk-to-Reward: Looks favorable (roughly 1:6), which is a strong risk management setup.
4. Key Levels to Watch
199.390 (Entry) → If price sustains above this, bulls are in control.
199.180 (Stop) → If price breaks below, expect further downside.
200.977 (Target) → This is the take-profit area, near prior resistance.
---
5. Confirmation Needed
Wait for a bullish candle confirmation at the entry zone (e.g., pin bar, engulfing candle) to reduce risk of false breakout.
Keep an eye on overall trend — if higher timeframes show strong downtrend, be cautious of reversals.
✅ Summary:
This chart suggests a buy setup from support zone with tight stop-loss and a large upside target. It’s a high risk-to-reward trade but requires confirmation before entering to avoid getting caught in a further drop.
Price is moving inside a descending channel (highlighted in pink).
Currently, price is near the lower boundary of the channel, suggesting possible support.
2. Entry, Stop Loss & Target
Entry Point: Around 199.390
This is placed slightly above the lower support of the channel, anticipating a bounce.
Stop Loss: Around 199.180
This is just below the support zone, keeping risk tight.
If price drops below this, it means the bullish idea is invalidated.
Target Point: Around 200.977
This is close to the upper range of the recent price action, giving a good risk-to-reward ratio.
3. Trade Idea
This setup is a buy (long) position plan:
Reasoning: Buying near support of the descending channel, expecting price to break out upwards.
Risk-to-Reward: Looks favorable (roughly 1:6), which is a strong risk management setup.
4. Key Levels to Watch
199.390 (Entry) → If price sustains above this, bulls are in control.
199.180 (Stop) → If price breaks below, expect further downside.
200.977 (Target) → This is the take-profit area, near prior resistance.
---
5. Confirmation Needed
Wait for a bullish candle confirmation at the entry zone (e.g., pin bar, engulfing candle) to reduce risk of false breakout.
Keep an eye on overall trend — if higher timeframes show strong downtrend, be cautious of reversals.
✅ Summary:
This chart suggests a buy setup from support zone with tight stop-loss and a large upside target. It’s a high risk-to-reward trade but requires confirmation before entering to avoid getting caught in a further drop.

join my telegram channel t.me/AI_algo_gold_master t.me/AI_algo_gold_master
Aviso legal
As informações e publicações não se destinam a ser, e não constituem, conselhos ou recomendações financeiras, de investimento, comerciais ou de outro tipo fornecidos ou endossados pela TradingView. Leia mais nos Termos de Uso.
join my telegram channel t.me/AI_algo_gold_master t.me/AI_algo_gold_master
Aviso legal
As informações e publicações não se destinam a ser, e não constituem, conselhos ou recomendações financeiras, de investimento, comerciais ou de outro tipo fornecidos ou endossados pela TradingView. Leia mais nos Termos de Uso.