Market Analysis: GBP/USD Bounces Back
Market Analysis: GBP/USD Bounces Back
GBP/USD is attempting a recovery wave above 1.3100.
Important Takeaways for GBP/USD Analysis Today
- The British Pound is attempting a fresh increase above 1.3120.
- There was a break above a bearish trend line with resistance at 1.3070 on the hourly chart of GBP/USD.
GBP/USD Technical Analysis
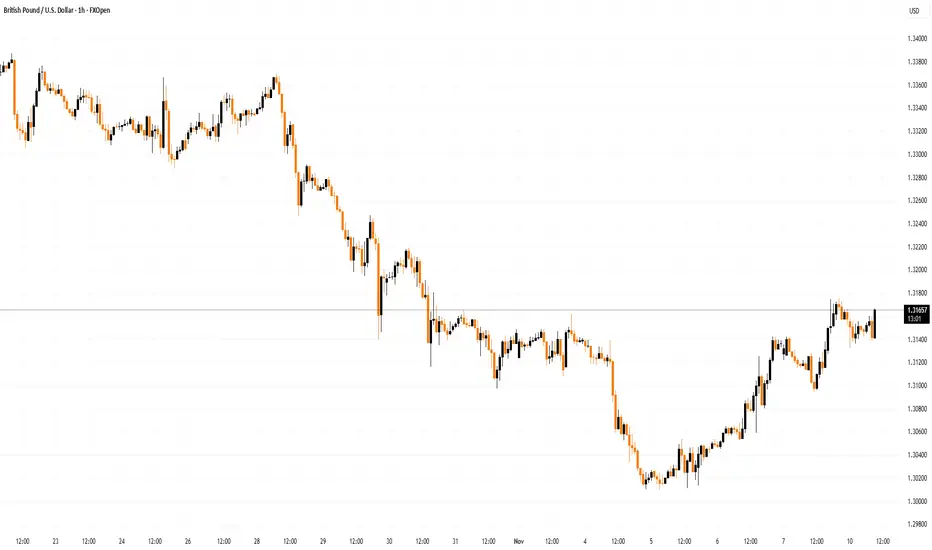
On the hourly chart of GBP/USD, the pair declined after it failed to clear 1.3370. As mentioned in the previous analysis, the British Pound even traded below 1.3250 against the US Dollar.
Finally, the pair tested the 1.3000 zone and is currently attempting a fresh increase. The bulls were able to push the pair above the 50-hour simple moving average and 1.3080. The pair even climbed above a bearish trend line with resistance at 1.3070.

The bulls were able to push the pair above the 23.6% Fib retracement level of the downward move from the 1.3369 swing high to the 1.3009 low.
On the upside, the GBP/USD chart indicates that the pair is facing hurdles near 1.3180. The next major barrier could be near the 50% Fib retracement at 1.3190. A close above 1.3190 could open the doors for a move toward 1.3285. Any more gains might send GBP/USD toward 1.3370.
On the downside, there is decent support forming at 1.3095. If there is a downside break below 1.3095, the pair could accelerate lower. The first area of interest might be near 1.3010, below which the pair could test 1.2950. Any more losses could lead the pair toward 1.2880.
This article represents the opinion of the Companies operating under the FXOpen brand only. It is not to be construed as an offer, solicitation, or recommendation with respect to products and services provided by the Companies operating under the FXOpen brand, nor is it to be considered financial advice.
GBP/USD is attempting a recovery wave above 1.3100.
Important Takeaways for GBP/USD Analysis Today
- The British Pound is attempting a fresh increase above 1.3120.
- There was a break above a bearish trend line with resistance at 1.3070 on the hourly chart of GBP/USD.
GBP/USD Technical Analysis
On the hourly chart of GBP/USD, the pair declined after it failed to clear 1.3370. As mentioned in the previous analysis, the British Pound even traded below 1.3250 against the US Dollar.
Finally, the pair tested the 1.3000 zone and is currently attempting a fresh increase. The bulls were able to push the pair above the 50-hour simple moving average and 1.3080. The pair even climbed above a bearish trend line with resistance at 1.3070.
The bulls were able to push the pair above the 23.6% Fib retracement level of the downward move from the 1.3369 swing high to the 1.3009 low.
On the upside, the GBP/USD chart indicates that the pair is facing hurdles near 1.3180. The next major barrier could be near the 50% Fib retracement at 1.3190. A close above 1.3190 could open the doors for a move toward 1.3285. Any more gains might send GBP/USD toward 1.3370.
On the downside, there is decent support forming at 1.3095. If there is a downside break below 1.3095, the pair could accelerate lower. The first area of interest might be near 1.3010, below which the pair could test 1.2950. Any more losses could lead the pair toward 1.2880.
This article represents the opinion of the Companies operating under the FXOpen brand only. It is not to be construed as an offer, solicitation, or recommendation with respect to products and services provided by the Companies operating under the FXOpen brand, nor is it to be considered financial advice.

Aviso legal
As informações e publicações não se destinam a ser, e não constituem, conselhos ou recomendações financeiras, de investimento, comerciais ou de outro tipo fornecidos ou endossados pela TradingView. Leia mais nos Termos de Uso.
Aviso legal
As informações e publicações não se destinam a ser, e não constituem, conselhos ou recomendações financeiras, de investimento, comerciais ou de outro tipo fornecidos ou endossados pela TradingView. Leia mais nos Termos de Uso.