

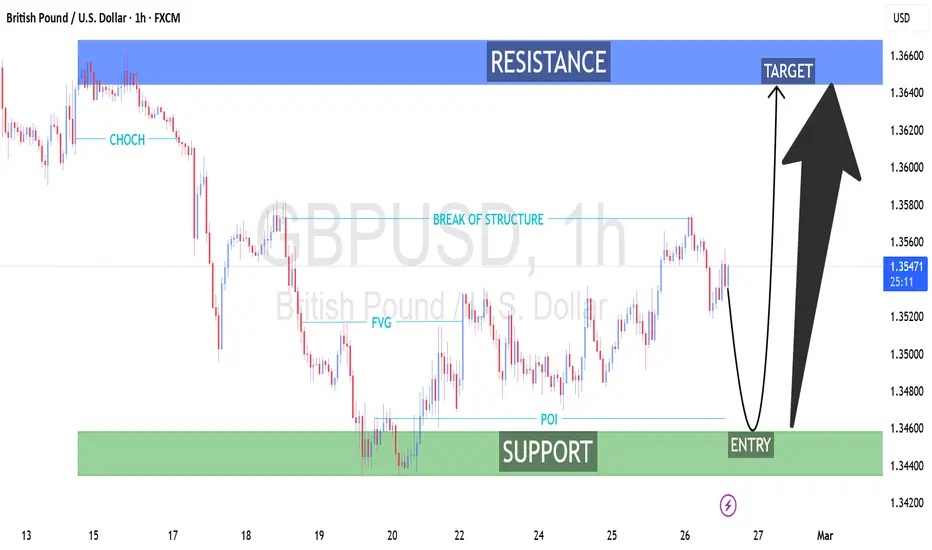
GBP/USD (1H) Technical Analysis
Smart Money Concepts (SMC) Structure-Based Outlook
1. Market Context
On the 1-hour timeframe, GBP/USD is trading within a broader short-term recovery phase after a prior impulsive bearish leg. Price is currently positioned mid-range between a well-defined support zone (demand) and a higher resistance zone (supply).
The chart reflects Smart Money Concepts (SMC) elements including:
CHoCH (Change of Character)
Break of Structure (BOS)
FVG (Fair Value Gap)
POI (Point of Interest)
Clearly defined Support and Resistance zones
2. Structure Analysis
🔹 Early Bearish Phase
A CHoCH signaled the shift from bullish to bearish structure.
This was followed by a strong impulsive sell-off creating a new lower low.
The downside move established a clear bearish order flow.
🔹 Accumulation & Demand Reaction
Price reached a strong support zone (~1.3440–1.3460).
Multiple rejections suggest institutional demand.
This area acts as a higher-timeframe liquidity pool.
🔹 Bullish Break of Structure (BOS)
A subsequent BOS confirmed short-term bullish order flow.
The bullish leg left behind a visible FVG, indicating imbalance.
The POI aligns with discount pricing inside the range.
3. Current Price Position
Price is now:
Retracing from a recent local high (~1.3580 area).
Moving back toward the support zone marked as “ENTRY”.
Potentially completing a corrective pullback before continuation.
This creates a classic pullback-to-demand continuation setup.
4. Trade Scenario Outlook
🟢 Bullish Scenario (Higher Probability Based on Structure)
Pullback into the support/demand zone.
Confirmation via:
Bullish rejection candles
Lower timeframe BOS
Liquidity sweep below support
Target:
Upper resistance zone (~1.3640–1.3660)
Risk-to-reward appears favorable if entry occurs deep in demand.
🔴 Bearish Invalidation
A clean break and sustained close below the support zone.
That would reintroduce bearish continuation toward lower liquidity.
5. Liquidity & Institutional Perspective
Equal highs near resistance suggest buy-side liquidity resting above.
The projected move likely aims to sweep that liquidity.
Market structure currently favors accumulation over distribution.
6. Professional Summary
The 1H structure shows:
Transition from bearish to bullish order flow.
Valid BOS confirming short-term upside bias.
Pullback into demand offering potential continuation entry.
Clear liquidity target at resistance.
Bias: Short-term bullish toward 1.3640–1.3660, provided support holds.
Smart Money Concepts (SMC) Structure-Based Outlook
1. Market Context
On the 1-hour timeframe, GBP/USD is trading within a broader short-term recovery phase after a prior impulsive bearish leg. Price is currently positioned mid-range between a well-defined support zone (demand) and a higher resistance zone (supply).
The chart reflects Smart Money Concepts (SMC) elements including:
CHoCH (Change of Character)
Break of Structure (BOS)
FVG (Fair Value Gap)
POI (Point of Interest)
Clearly defined Support and Resistance zones
2. Structure Analysis
🔹 Early Bearish Phase
A CHoCH signaled the shift from bullish to bearish structure.
This was followed by a strong impulsive sell-off creating a new lower low.
The downside move established a clear bearish order flow.
🔹 Accumulation & Demand Reaction
Price reached a strong support zone (~1.3440–1.3460).
Multiple rejections suggest institutional demand.
This area acts as a higher-timeframe liquidity pool.
🔹 Bullish Break of Structure (BOS)
A subsequent BOS confirmed short-term bullish order flow.
The bullish leg left behind a visible FVG, indicating imbalance.
The POI aligns with discount pricing inside the range.
3. Current Price Position
Price is now:
Retracing from a recent local high (~1.3580 area).
Moving back toward the support zone marked as “ENTRY”.
Potentially completing a corrective pullback before continuation.
This creates a classic pullback-to-demand continuation setup.
4. Trade Scenario Outlook
🟢 Bullish Scenario (Higher Probability Based on Structure)
Pullback into the support/demand zone.
Confirmation via:
Bullish rejection candles
Lower timeframe BOS
Liquidity sweep below support
Target:
Upper resistance zone (~1.3640–1.3660)
Risk-to-reward appears favorable if entry occurs deep in demand.
🔴 Bearish Invalidation
A clean break and sustained close below the support zone.
That would reintroduce bearish continuation toward lower liquidity.
5. Liquidity & Institutional Perspective
Equal highs near resistance suggest buy-side liquidity resting above.
The projected move likely aims to sweep that liquidity.
Market structure currently favors accumulation over distribution.
6. Professional Summary
The 1H structure shows:
Transition from bearish to bullish order flow.
Valid BOS confirming short-term upside bias.
Pullback into demand offering potential continuation entry.
Clear liquidity target at resistance.
Bias: Short-term bullish toward 1.3640–1.3660, provided support holds.

Publicações relacionadas
Aviso legal
As informações e publicações não se destinam a ser, e não constituem, conselhos ou recomendações financeiras, de investimento, comerciais ou de outro tipo fornecidos ou endossados pela TradingView. Leia mais nos Termos de Uso.
Publicações relacionadas
Aviso legal
As informações e publicações não se destinam a ser, e não constituem, conselhos ou recomendações financeiras, de investimento, comerciais ou de outro tipo fornecidos ou endossados pela TradingView. Leia mais nos Termos de Uso.