
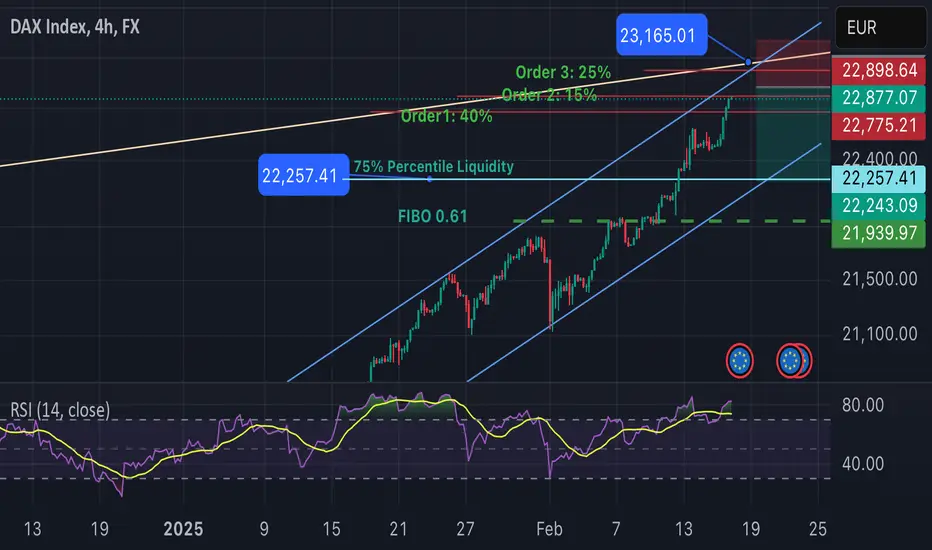
. Trend Lines and Moving Averages:
• Moving Averages (MA): Check the 50-day and 200-day moving averages. DAX is trading above these averages and the 50-day is above the 200-day, that generally indicates an upward trend. A crossover (where the 50-day falls below the 200-day) might suggest a shift to a bearish trend. Stay tuned!!
• Trend Lines: Draw trend lines connecting recent highs & lows. An upward-sloping trend line suggests bullish momentum, Which, in reality triggers an alarm for shortterm buyers to start selling and waiting for a pull back to buy cheaper by waiting downward-sloping bearish pressure.
2. Relative Strength Index (RSI):
• An RSI above 70 typically indicates that the asset might be overbought, suggesting a possible pullback or consolidation.

Aviso legal
As informações e publicações não se destinam a ser, e não constituem, conselhos ou recomendações financeiras, de investimento, comerciais ou de outro tipo fornecidos ou endossados pela TradingView. Leia mais nos Termos de Uso.
Aviso legal
As informações e publicações não se destinam a ser, e não constituem, conselhos ou recomendações financeiras, de investimento, comerciais ou de outro tipo fornecidos ou endossados pela TradingView. Leia mais nos Termos de Uso.