
1. The Macro Perspective: The Deep Washout and Multi-Year Accumulation
I am taking a LONG bias on Gland Pharma Limited (GLAND) on the weekly (1W) timeframe.
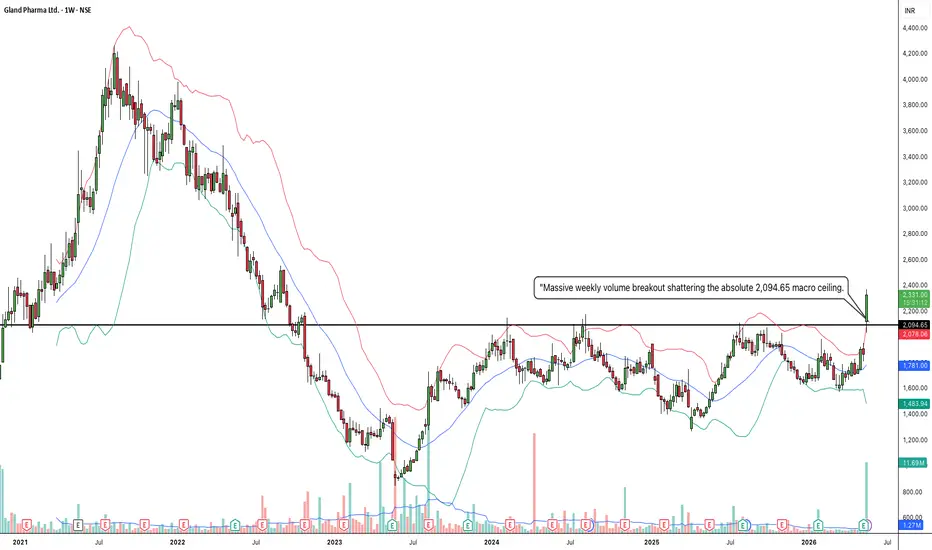
When analyzing pure market structure, the most powerful and sustainable secular trends are born from grueling, exhaustive accumulation phases. Look at the massive structural development spanning this entire chart. After a massive historical markdown phase, the stock spent over two years locked in a brutal macro accumulation base. This prolonged sideways grinding acts as a massive washing machine—it completely exhausts and washes out weak, impatient retail traders, allowing strong-handed institutional buyers to quietly absorb all available liquidity at heavily discounted prices.
2. The Educational Setup: The Ultimate Structural Ceiling and Launchpad
To understand the sheer technical validity of this macro breakout, look at the precise mechanics aligning right before the launch:
The Absolute Concrete Ceiling: By adjusting our horizontal resistance line to the absolute peak of the structural highs at 2,094.65, we define the ultimate macro battlefield. Sellers repeatedly swatted the price down from this exact pivot point over the last two years, creating a heavy, undeniable historical supply zone.
The 20 SMA Defense: Notice how the price behaved beneath this ultimate ceiling over the last few months. Instead of suffering another deep collapse, institutional buyers aggressively stepped in, reclaiming the weekly 20 SMA (the middle blue line of your Bollinger Bands) and establishing a series of higher lows. By chopping sideways right below the massive resistance and letting the moving average catch up, the stock created a perfect, tightly coiled structural launchpad.
3. Current Price Action: Volatility Expansion and Pure Markup
Look at the most recent weekly candle on the far right. The high-level pressure cooker has absolutely exploded. Buyers have stepped in with massive conviction, printing a powerhouse of a green weekly expansion candle backed by a heavy institutional volume spike. This single vertical thrust has effortlessly obliterated the 2,094.65 multi-year ceiling, pushing the price well into the 2,300s. Furthermore, the price has violently pierced and is riding entirely outside the upper Bollinger Band, snapping the bands wide open. By decisively clearing this ultimate accumulation block, GLAND has officially initiated a highly aggressive new secular markup phase into pure price discovery.
4. The Trade Plan: Entries, Targets, and Risk Management
Entry Strategy: Macro momentum is exceptionally strong right now near 2,331.00. Chasing a massive vertical weekly candle closing entirely outside the upper Bollinger Band always carries a severe risk of an agonizing short-term mean-reversion pullback as the stock naturally breathes. The highest-probability, lowest-risk entry involves stepping down to a daily timeframe and waiting for the initial vertical excitement to cool off. Look to place limit orders to catch a potential structural pullback to perfectly retest the 2,050.00 to 2,120.00 broken resistance zone. Letting old historical resistance prove itself as a concrete new support floor offers a phenomenal risk-to-reward ratio.
Take Profit (Targets): Because the stock is breaking out of a massive multi-year structure, we use a measured move strategy based on the depth of the macro base. By taking the core depth of this consolidation (roughly 800 points from the ~1,300 structural floors up to the 2,094.65 absolute ceiling) and projecting it upward from the breakout point, our primary structural macro target sits comfortably in the 2,850.00 to 2,900.00 zone. The ultimate psychological round number of 2,500.00 will act as the immediate macro magnet.
Invalidation (Stop Loss): An explosive macro breakout thesis is completely invalidated if the stock crashes back deep inside the old consolidation boundaries. A hard stop loss should be placed safely below the breakout zone and the rising weekly 20 SMA, around the 1,750.00 to 1,850.00 level. A definitive weekly close completely back below the moving average would confirm a massive failed breakout and a severe macro bull trap.
5. Time Horizon:
Because this technical setup is built on a 1-Week chart capturing a massive structural phase transition and an ultimate macro base breakout, this is a medium-to-longer-term position trade designed to capture a secular markup phase over the coming months. Let the macro trend run!
I am taking a LONG bias on Gland Pharma Limited (GLAND) on the weekly (1W) timeframe.
When analyzing pure market structure, the most powerful and sustainable secular trends are born from grueling, exhaustive accumulation phases. Look at the massive structural development spanning this entire chart. After a massive historical markdown phase, the stock spent over two years locked in a brutal macro accumulation base. This prolonged sideways grinding acts as a massive washing machine—it completely exhausts and washes out weak, impatient retail traders, allowing strong-handed institutional buyers to quietly absorb all available liquidity at heavily discounted prices.
2. The Educational Setup: The Ultimate Structural Ceiling and Launchpad
To understand the sheer technical validity of this macro breakout, look at the precise mechanics aligning right before the launch:
The Absolute Concrete Ceiling: By adjusting our horizontal resistance line to the absolute peak of the structural highs at 2,094.65, we define the ultimate macro battlefield. Sellers repeatedly swatted the price down from this exact pivot point over the last two years, creating a heavy, undeniable historical supply zone.
The 20 SMA Defense: Notice how the price behaved beneath this ultimate ceiling over the last few months. Instead of suffering another deep collapse, institutional buyers aggressively stepped in, reclaiming the weekly 20 SMA (the middle blue line of your Bollinger Bands) and establishing a series of higher lows. By chopping sideways right below the massive resistance and letting the moving average catch up, the stock created a perfect, tightly coiled structural launchpad.
3. Current Price Action: Volatility Expansion and Pure Markup
Look at the most recent weekly candle on the far right. The high-level pressure cooker has absolutely exploded. Buyers have stepped in with massive conviction, printing a powerhouse of a green weekly expansion candle backed by a heavy institutional volume spike. This single vertical thrust has effortlessly obliterated the 2,094.65 multi-year ceiling, pushing the price well into the 2,300s. Furthermore, the price has violently pierced and is riding entirely outside the upper Bollinger Band, snapping the bands wide open. By decisively clearing this ultimate accumulation block, GLAND has officially initiated a highly aggressive new secular markup phase into pure price discovery.
4. The Trade Plan: Entries, Targets, and Risk Management
Entry Strategy: Macro momentum is exceptionally strong right now near 2,331.00. Chasing a massive vertical weekly candle closing entirely outside the upper Bollinger Band always carries a severe risk of an agonizing short-term mean-reversion pullback as the stock naturally breathes. The highest-probability, lowest-risk entry involves stepping down to a daily timeframe and waiting for the initial vertical excitement to cool off. Look to place limit orders to catch a potential structural pullback to perfectly retest the 2,050.00 to 2,120.00 broken resistance zone. Letting old historical resistance prove itself as a concrete new support floor offers a phenomenal risk-to-reward ratio.
Take Profit (Targets): Because the stock is breaking out of a massive multi-year structure, we use a measured move strategy based on the depth of the macro base. By taking the core depth of this consolidation (roughly 800 points from the ~1,300 structural floors up to the 2,094.65 absolute ceiling) and projecting it upward from the breakout point, our primary structural macro target sits comfortably in the 2,850.00 to 2,900.00 zone. The ultimate psychological round number of 2,500.00 will act as the immediate macro magnet.
Invalidation (Stop Loss): An explosive macro breakout thesis is completely invalidated if the stock crashes back deep inside the old consolidation boundaries. A hard stop loss should be placed safely below the breakout zone and the rising weekly 20 SMA, around the 1,750.00 to 1,850.00 level. A definitive weekly close completely back below the moving average would confirm a massive failed breakout and a severe macro bull trap.
5. Time Horizon:
Because this technical setup is built on a 1-Week chart capturing a massive structural phase transition and an ultimate macro base breakout, this is a medium-to-longer-term position trade designed to capture a secular markup phase over the coming months. Let the macro trend run!
Trade ativo
After successful breakout price is consolidating.Trade fechado: objetivo atingido
Target already achieved.
Aviso legal
As informações e publicações não se destinam a ser, e não constituem, conselhos ou recomendações financeiras, de investimento, comerciais ou de outro tipo fornecidos ou endossados pela TradingView. Leia mais nos Termos de Uso.
Aviso legal
As informações e publicações não se destinam a ser, e não constituem, conselhos ou recomendações financeiras, de investimento, comerciais ou de outro tipo fornecidos ou endossados pela TradingView. Leia mais nos Termos de Uso.