
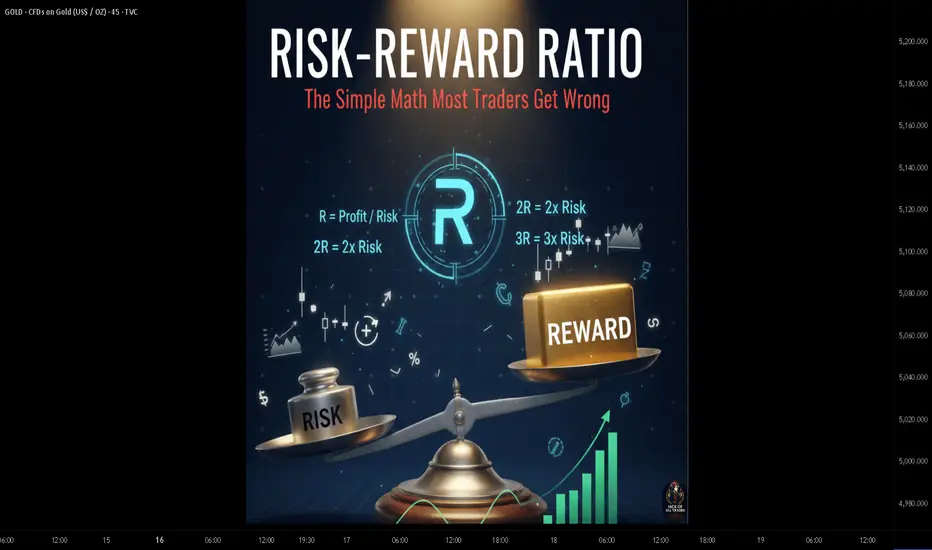
You Can Be Wrong 60% of the Time and Still Make Money
Most traders obsess over win rate.
"I need to be right more often."
But here's the math that changes everything:
A trader who wins 40% of the time with 3:1 risk-reward makes more money than a trader who wins 60% of the time with 1:1 risk-reward.
Let's break down why.
What Is Risk-Reward Ratio?
Definition:
Risk-reward ratio compares the potential profit of a trade to its potential loss.
Formula:
Risk-Reward Ratio = Potential Reward / Potential Risk
Example:
Meaning: You're risking $1 to potentially make $3.
The R-Multiple Framework
What Is R?
R = Your initial risk on a trade
R-Multiple:
How many R's you made or lost on a trade.
Examples:
Why R-Multiples Matter:
They normalize results across different position sizes and allow meaningful comparison.
The Math of Expectancy
Expectancy Formula:
Expectancy = (Win Rate × Average Win) - (Loss Rate × Average Loss)
In R-Terms:
Expectancy = (Win Rate × Avg R on Wins) - (Loss Rate × Avg R on Losses)
Example 1: High Win Rate, Low R
Example 2: Low Win Rate, High R
The Insight:
Example 2 has LOWER win rate but HIGHER expectancy.
Win Rate vs Risk-Reward Tradeoff
There's typically an inverse relationship:
The Question:
What combination maximizes expectancy?
Breakeven Win Rates by R:R:
Why Most Traders Get This Wrong
Mistake 1: Chasing Win Rate
Mistake 2: Ignoring Risk
Mistake 3: Moving Targets
Mistake 4: Not Tracking R-Multiples
Setting Realistic Risk-Reward Targets
Factor 1: Market Structure
Factor 2: Volatility
Factor 3: Timeframe
Factor 4: Historical Analysis
Risk-Reward Strategies
Strategy 1: Fixed R:R
Always target the same R:R ratio.
Example:
Pros: Easy to implement, consistent
Cons: May not match market structure
Strategy 2: Structure-Based Targets
Set targets based on chart structure.
Example:
Pros: Logical targets, adapts to market
Cons: Variable R:R, requires analysis
Strategy 3: Scaled Exits
Take profits at multiple levels.
Example:
Pros: Locks in some profit, lets rest run
Cons: More complex, average R may be lower
Strategy 4: Trailing for Extended R
Use trailing stops to capture large moves.
Example:
Pros: Captures outlier wins
Cons: Gives back some profit on reversals
AI-Enhanced Risk-Reward Optimization
1. Optimal Target Calculation
AI analyzes historical data to find:
2. Dynamic R:R Adjustment
AI adjusts targets based on:
3. Probability-Weighted Targets
AI calculates:
4. Trade Filtering
AI filters trades by R:R potential:
Tracking Your R-Multiples
What to Track:
Analysis Questions:
Risk-Reward Reality Check
Unrealistic Expectations:
Realistic Expectations:
The R-Multiple Mindset
Think in R, Not Dollars:
Focus on Expectancy, Not Win Rate:
Accept Losses as Cost of Business:
Key Takeaways
Your Turn
What risk-reward ratio do you typically target?
Do you track your trades in R-multiples?
Share your approach below 👇
Most traders obsess over win rate.
"I need to be right more often."
But here's the math that changes everything:
A trader who wins 40% of the time with 3:1 risk-reward makes more money than a trader who wins 60% of the time with 1:1 risk-reward.
Let's break down why.
What Is Risk-Reward Ratio?
Definition:
Risk-reward ratio compares the potential profit of a trade to its potential loss.
Formula:
Risk-Reward Ratio = Potential Reward / Potential Risk
Example:
- Entry: $100
- Stop Loss: $95 (Risk = $5)
- Target: $115 (Reward = $15)
- Risk-Reward = $15 / $5 = 3:1
Meaning: You're risking $1 to potentially make $3.
The R-Multiple Framework
What Is R?
R = Your initial risk on a trade
R-Multiple:
How many R's you made or lost on a trade.
Examples:
- Risk $100, make $300 = +3R
- Risk $100, lose $100 = -1R
- Risk $100, make $50 = +0.5R
- Risk $100, lose $50 = -0.5R
Why R-Multiples Matter:
They normalize results across different position sizes and allow meaningful comparison.
The Math of Expectancy
Expectancy Formula:
Expectancy = (Win Rate × Average Win) - (Loss Rate × Average Loss)
In R-Terms:
Expectancy = (Win Rate × Avg R on Wins) - (Loss Rate × Avg R on Losses)
Example 1: High Win Rate, Low R
- Win Rate: 70%
- Average Win: 1R
- Average Loss: 1R
- Expectancy = (0.70 × 1) - (0.30 × 1) = 0.40R per trade
Example 2: Low Win Rate, High R
- Win Rate: 40%
- Average Win: 3R
- Average Loss: 1R
- Expectancy = (0.40 × 3) - (0.60 × 1) = 0.60R per trade
The Insight:
Example 2 has LOWER win rate but HIGHER expectancy.
Win Rate vs Risk-Reward Tradeoff
There's typically an inverse relationship:
- Tighter targets = Higher win rate, lower R
- Wider targets = Lower win rate, higher R
The Question:
What combination maximizes expectancy?
Breakeven Win Rates by R:R:
- 1:1 R:R → Need 50% win rate to break even
- 2:1 R:R → Need 33% win rate to break even
- 3:1 R:R → Need 25% win rate to break even
- 4:1 R:R → Need 20% win rate to break even
- 5:1 R:R → Need 17% win rate to break even
Why Most Traders Get This Wrong
Mistake 1: Chasing Win Rate
- Taking profits too early to "lock in wins"
- Turning potential 3R winners into 0.5R winners
- High win rate, low expectancy
Mistake 2: Ignoring Risk
- No stop loss = undefined risk
- Can't calculate R:R without knowing risk
- One bad trade wipes out many winners
Mistake 3: Moving Targets
- Changing target based on emotions
- Exiting early out of fear
- Holding losers hoping they'll recover
Mistake 4: Not Tracking R-Multiples
- Only tracking P&L in dollars
- Can't identify if R:R is working
- No data for optimization
Setting Realistic Risk-Reward Targets
Factor 1: Market Structure
- Where is the next support/resistance?
- Is there room for your target?
- Don't set targets beyond logical levels
Factor 2: Volatility
- Higher volatility = wider stops needed
- Targets should scale with volatility
- Use ATR to calibrate
Factor 3: Timeframe
- Longer timeframes = larger moves possible
- Shorter timeframes = tighter targets
- Match R:R to timeframe
Factor 4: Historical Analysis
- What R:R has your strategy achieved historically?
- What's realistic for this setup type?
- Don't assume unrealistic R:R
Risk-Reward Strategies
Strategy 1: Fixed R:R
Always target the same R:R ratio.
Example:
- Always target 2:1
- Risk $100, target $200
- Simple, consistent
Pros: Easy to implement, consistent
Cons: May not match market structure
Strategy 2: Structure-Based Targets
Set targets based on chart structure.
Example:
- Target = Next resistance level
- Only take trade if R:R > 2:1
- Skip trades with poor R:R
Pros: Logical targets, adapts to market
Cons: Variable R:R, requires analysis
Strategy 3: Scaled Exits
Take profits at multiple levels.
Example:
- 1/3 at 1R
- 1/3 at 2R
- 1/3 trailing
Pros: Locks in some profit, lets rest run
Cons: More complex, average R may be lower
Strategy 4: Trailing for Extended R
Use trailing stops to capture large moves.
Example:
- Initial target: 2R
- If reached, switch to trailing stop
- Potential for 5R+ on big moves
Pros: Captures outlier wins
Cons: Gives back some profit on reversals
AI-Enhanced Risk-Reward Optimization
1. Optimal Target Calculation
AI analyzes historical data to find:
- What R:R maximizes expectancy for this setup?
- Where do most winning trades reach?
- Where do most losing trades reverse?
2. Dynamic R:R Adjustment
AI adjusts targets based on:
- Current volatility
- Market regime
- Time of day
- Recent performance
3. Probability-Weighted Targets
AI calculates:
- Probability of reaching 1R, 2R, 3R
- Expected value at each target
- Optimal exit strategy
4. Trade Filtering
AI filters trades by R:R potential:
- Only take trades with R:R > threshold
- Rank setups by expected R
- Allocate more to higher R:R opportunities
Tracking Your R-Multiples
What to Track:
- Initial R (risk) for each trade
- Actual R achieved (positive or negative)
- Average R on winners
- Average R on losers
- Expectancy in R
Analysis Questions:
- What's my average winning R?
- Am I cutting winners too short?
- Am I letting losers run too long?
- What R:R setups perform best?
Risk-Reward Reality Check
Unrealistic Expectations:
- "I only take 5:1 trades" — These are rare
- "I never lose more than 0.5R" — Slippage happens
- "My average win is 4R" — Verify with data
Realistic Expectations:
- Average R on winners: 1.5-2.5R is good
- Average R on losers: -0.8 to -1.2R is normal
- Expectancy: 0.2-0.5R per trade is solid
The R-Multiple Mindset
Think in R, Not Dollars:
- "I made 2R" not "I made $500"
- "I lost 1R" not "I lost $250"
- Normalizes across different position sizes
Focus on Expectancy, Not Win Rate:
- A losing streak doesn't mean the system is broken
- If expectancy is positive, results will come
- Trust the math over short-term results
Accept Losses as Cost of Business:
- -1R losses are expected and planned
- They're the "cost" of being in the game
- Winners more than compensate
Key Takeaways
- Risk-reward ratio matters more than win rate for profitability
- R-multiples normalize results and enable meaningful analysis
- Expectancy = (Win Rate × Avg Win R) - (Loss Rate × Avg Loss R)
- You can be wrong more than half the time and still profit with good R:R
- Track R-multiples religiously to optimize your trading
Your Turn
What risk-reward ratio do you typically target?
Do you track your trades in R-multiples?
Share your approach below 👇

The Institutional Grade Trading Ecosystem, Built to win trades 📈
Get Access 👇
jackofalltrades.vip 🌐
t.me/jackofalltradesvip 🃏
Get Access 👇
jackofalltrades.vip 🌐
t.me/jackofalltradesvip 🃏
Aviso legal
As informações e publicações não se destinam a ser, e não constituem, conselhos ou recomendações financeiras, de investimento, comerciais ou de outro tipo fornecidos ou endossados pela TradingView. Leia mais nos Termos de Uso.
The Institutional Grade Trading Ecosystem, Built to win trades 📈
Get Access 👇
jackofalltrades.vip 🌐
t.me/jackofalltradesvip 🃏
Get Access 👇
jackofalltrades.vip 🌐
t.me/jackofalltradesvip 🃏
Aviso legal
As informações e publicações não se destinam a ser, e não constituem, conselhos ou recomendações financeiras, de investimento, comerciais ou de outro tipo fornecidos ou endossados pela TradingView. Leia mais nos Termos de Uso.