
Market Analysis:
On Thursday (April 16th) in early Asian trading, spot gold prices fell sharply after hitting a one-month high of $4870. This pullback in London gold prices is not a simple technical adjustment, but an inevitable result of the deep interplay between global macroeconomics and geopolitics. The window of opportunity for the US-Iran conflict to transition from "hot war" to "peace talks" means that every development in US-Iran negotiations, every fluctuation in oil prices, and every statement from Federal Reserve officials will determine the fate of gold in the next stage.
Currently, the recovery in market risk appetite has, to some extent, suppressed safe-haven demand for gold. At the same time, the temporary stabilization of the US dollar index has also directly suppressed gold prices. However, continued central bank gold purchases and persistent geopolitical risks provide strong support below. Currently, the international gold market is approaching the key US CPI data release window, and short-term investors are choosing to take profits, causing gold prices to fluctuate repeatedly at high levels, but the overall medium-term bullish trend remains unchanged.
Technical Analysis:
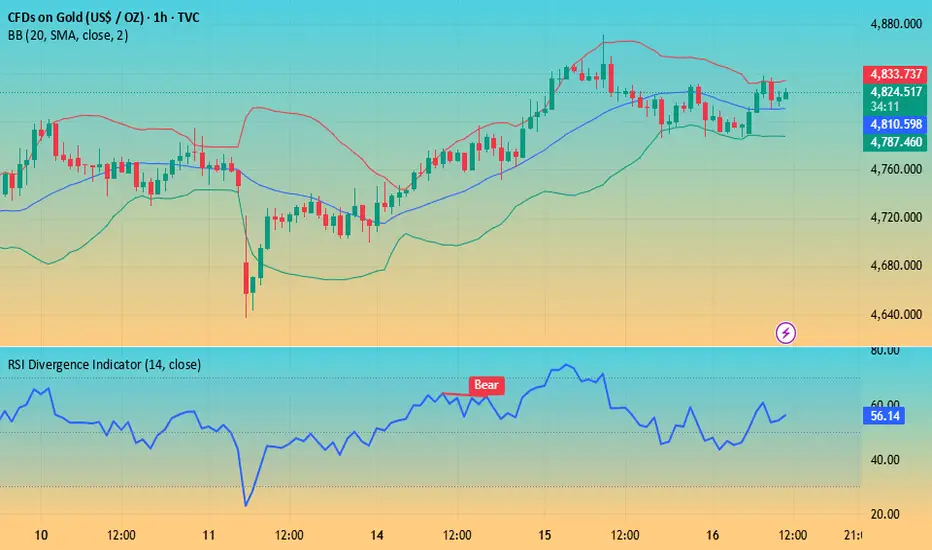
Spot gold is maintaining a wide-range trading pattern, with support forming in the 4750-4780 area, and resistance concentrated at 4850/4880. The intraday trend is expected to remain range-bound. Although yesterday's daily candlestick closed small bearish, the New York closing price remained above the MA10/daily moving averages of 4745/4775. The RSI indicator remains above the midline, and the hourly and four-hour charts show moving averages converging, with the Bollinger Bands narrowing. This range-bound movement is expected to continue. The main strategy for the day is to buy on dips and sell on rallies.
From the chart pattern, gold prices are maintaining a high-level range-bound movement, with particularly strong support around 4780. Multiple tests of this level have resulted in quick rebounds. On the 4-hour chart, international gold prices are consolidating at high levels, with the RSI indicator gradually declining from overbought territory and the Bollinger Bands flattening. A short-term technical correction and adjustment is expected, with short-term trading primarily focused on range-bound trading.
Trading Strategy:
Buy gold at 4770-4780 (short-term), stop-loss at 4750, target 4850-4900;
Sell gold at 4880-4890 (short-term), stop-loss at 4910, target 4800-4750;
Key Levels:
First Resistance: 4850, Second Resistance: 4878, Third Resistance: 4905
First Support: 4800, Second Support: 4778, Third Support: 4750
On Thursday (April 16th) in early Asian trading, spot gold prices fell sharply after hitting a one-month high of $4870. This pullback in London gold prices is not a simple technical adjustment, but an inevitable result of the deep interplay between global macroeconomics and geopolitics. The window of opportunity for the US-Iran conflict to transition from "hot war" to "peace talks" means that every development in US-Iran negotiations, every fluctuation in oil prices, and every statement from Federal Reserve officials will determine the fate of gold in the next stage.
Currently, the recovery in market risk appetite has, to some extent, suppressed safe-haven demand for gold. At the same time, the temporary stabilization of the US dollar index has also directly suppressed gold prices. However, continued central bank gold purchases and persistent geopolitical risks provide strong support below. Currently, the international gold market is approaching the key US CPI data release window, and short-term investors are choosing to take profits, causing gold prices to fluctuate repeatedly at high levels, but the overall medium-term bullish trend remains unchanged.
Technical Analysis:
Spot gold is maintaining a wide-range trading pattern, with support forming in the 4750-4780 area, and resistance concentrated at 4850/4880. The intraday trend is expected to remain range-bound. Although yesterday's daily candlestick closed small bearish, the New York closing price remained above the MA10/daily moving averages of 4745/4775. The RSI indicator remains above the midline, and the hourly and four-hour charts show moving averages converging, with the Bollinger Bands narrowing. This range-bound movement is expected to continue. The main strategy for the day is to buy on dips and sell on rallies.
From the chart pattern, gold prices are maintaining a high-level range-bound movement, with particularly strong support around 4780. Multiple tests of this level have resulted in quick rebounds. On the 4-hour chart, international gold prices are consolidating at high levels, with the RSI indicator gradually declining from overbought territory and the Bollinger Bands flattening. A short-term technical correction and adjustment is expected, with short-term trading primarily focused on range-bound trading.
Trading Strategy:
Buy gold at 4770-4780 (short-term), stop-loss at 4750, target 4850-4900;
Sell gold at 4880-4890 (short-term), stop-loss at 4910, target 4800-4750;
Key Levels:
First Resistance: 4850, Second Resistance: 4878, Third Resistance: 4905
First Support: 4800, Second Support: 4778, Third Support: 4750

Aviso legal
As informações e publicações não se destinam a ser, e não constituem, conselhos ou recomendações financeiras, de investimento, comerciais ou de outro tipo fornecidos ou endossados pela TradingView. Leia mais nos Termos de Uso.
Aviso legal
As informações e publicações não se destinam a ser, e não constituem, conselhos ou recomendações financeiras, de investimento, comerciais ou de outro tipo fornecidos ou endossados pela TradingView. Leia mais nos Termos de Uso.