
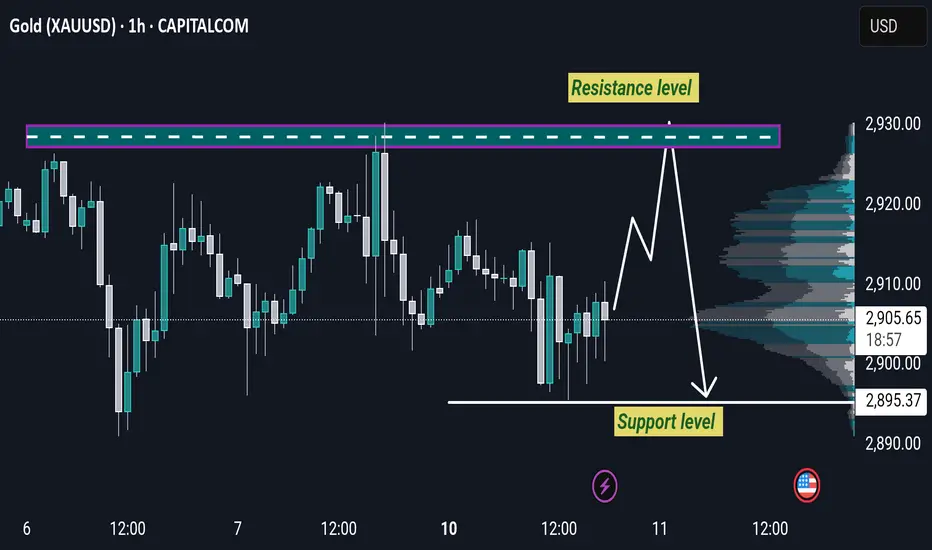
This chart represents the price movement of Gold (XAU/USD) on a 1-hour timeframe, with key technical levels and a potential price movement scenario.
Analysis:
1. Resistance Level:
The chart highlights a resistance level around the 2,929 price zone, marked by a purple horizontal line.
The price has struggled to break above this level multiple times, indicating strong selling pressure.
2. Support Level:
A support level is identified near 2,895, shown with a white horizontal line.
The price has bounced off this level in previous instances, suggesting strong buying interest.
3. Potential Price Movement:
The projection suggests that the price may first attempt to break above the resistance level.
If it fails to sustain above resistance, it could lead to a reversal and a decline toward the support zone.
If the support level holds, a rebound may occur.
Conclusion:
This setup indicates a range-bound market, where traders might look for sell opportunities near resistance and buy opportunities at support until a breakout occurs in either direction. A decisive breakout above resistance or below support would determine the next trend direction.
Analysis:
1. Resistance Level:
The chart highlights a resistance level around the 2,929 price zone, marked by a purple horizontal line.
The price has struggled to break above this level multiple times, indicating strong selling pressure.
2. Support Level:
A support level is identified near 2,895, shown with a white horizontal line.
The price has bounced off this level in previous instances, suggesting strong buying interest.
3. Potential Price Movement:
The projection suggests that the price may first attempt to break above the resistance level.
If it fails to sustain above resistance, it could lead to a reversal and a decline toward the support zone.
If the support level holds, a rebound may occur.
Conclusion:
This setup indicates a range-bound market, where traders might look for sell opportunities near resistance and buy opportunities at support until a breakout occurs in either direction. A decisive breakout above resistance or below support would determine the next trend direction.
Trade ativo
Hold buy
Telegram channel 👇🏻👇🏻
t.me/+jIZ9Ca0rlGwwY2E8
🔥 What You’ll Get:
✅ Daily Forex signals with high accuracy
✅ Also We Will Guide You
Telegram channel 👇🏻👇🏻
t.me/+jIZ9Ca0rlGwwY2E8
t.me/+jIZ9Ca0rlGwwY2E8
🔥 What You’ll Get:
✅ Daily Forex signals with high accuracy
✅ Also We Will Guide You
Telegram channel 👇🏻👇🏻
t.me/+jIZ9Ca0rlGwwY2E8
Aviso legal
As informações e publicações não se destinam a ser, e não constituem, conselhos ou recomendações financeiras, de investimento, comerciais ou de outro tipo fornecidos ou endossados pela TradingView. Leia mais nos Termos de Uso.
Telegram channel 👇🏻👇🏻
t.me/+jIZ9Ca0rlGwwY2E8
🔥 What You’ll Get:
✅ Daily Forex signals with high accuracy
✅ Also We Will Guide You
Telegram channel 👇🏻👇🏻
t.me/+jIZ9Ca0rlGwwY2E8
t.me/+jIZ9Ca0rlGwwY2E8
🔥 What You’ll Get:
✅ Daily Forex signals with high accuracy
✅ Also We Will Guide You
Telegram channel 👇🏻👇🏻
t.me/+jIZ9Ca0rlGwwY2E8
Aviso legal
As informações e publicações não se destinam a ser, e não constituem, conselhos ou recomendações financeiras, de investimento, comerciais ou de outro tipo fornecidos ou endossados pela TradingView. Leia mais nos Termos de Uso.