
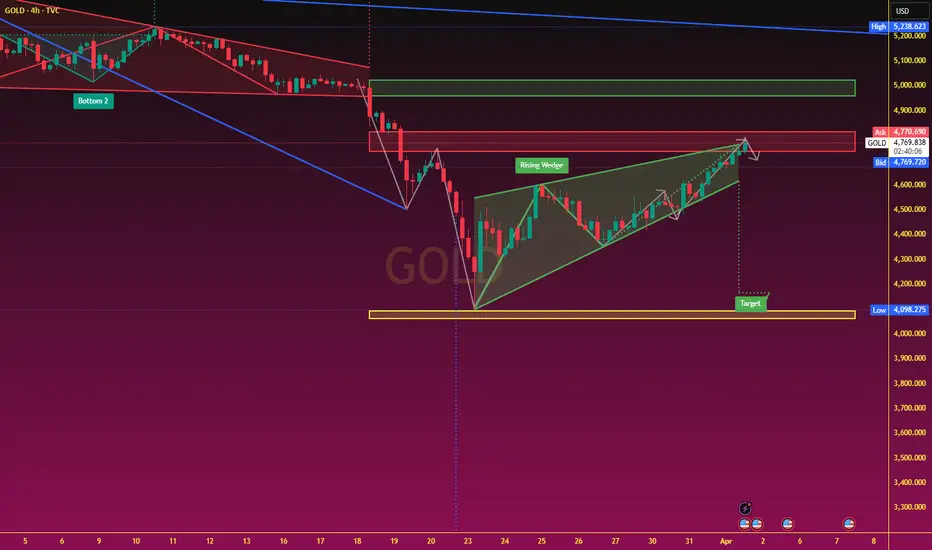
First Support Level: $4690–$4680. This level corresponds precisely to the middle band of the Bollinger Bands on the hourly chart and serves as a short-term, intraday support level. Second Support Level: $4650–$4640. This constitutes a robust support level established following yesterday's breakout move; on the 4-hour chart timeframe, it represents a critical support zone. There is a very high probability that the price will retest this area and find stability. **Strong Support / Bull-Bear Divide: $4600. This level marks both a previous zone of high trading volume concentration and a significant psychological threshold; should the price decisively break below this level, it would signal the invalidation of the short-term bullish trend. Resistance Levels (from nearest to furthest): First Resistance Level: $4770–$4790; Strong Resistance Level: $4800–$4810. This zone converges a series of recent highs and faces significant pressure from profit-taking; simultaneously, it acts as a major psychological barrier within the medium-term trend.
Trading Strategy: Avoid chasing highs. The core strategy should be defined as "buying on dips" (entering long positions during price pullbacks), while "selling on rallies" (entering short positions during price rebounds) serves as a supplementary strategy. On the upside, short-term attention should focus on the resistance zone—characterized by selling pressure—between $4780 and $4810; on the downside, attention should be directed toward the support zone—characterized by buying interest—between $4720 and $4685.
Nota
Trading Core: Continuously monitor these detailed and accurate signal channels or engage in personal communication. Traders who follow these signals will eventually succeed.Trade fechado: objetivo atingido
This chart's trend analysis is completely consistent with actual market movements.
Aviso legal
As informações e publicações não se destinam a ser, e não constituem, conselhos ou recomendações financeiras, de investimento, comerciais ou de outro tipo fornecidos ou endossados pela TradingView. Leia mais nos Termos de Uso.
Aviso legal
As informações e publicações não se destinam a ser, e não constituem, conselhos ou recomendações financeiras, de investimento, comerciais ou de outro tipo fornecidos ou endossados pela TradingView. Leia mais nos Termos de Uso.