
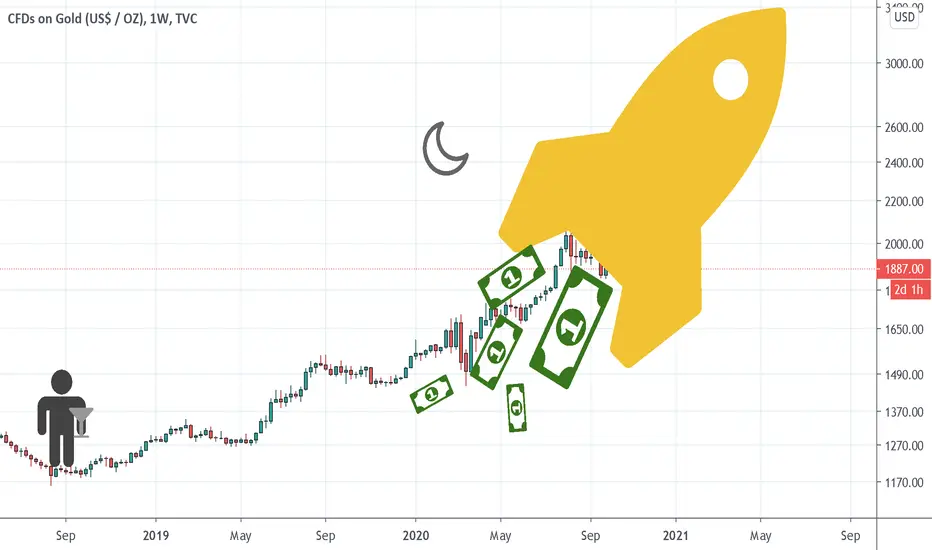
Gold is zooming.
Why?
The DXY.
As we can see on the monthly DXY chart, the developing pattern parallels history.
1. It bounced off the 200 EMA
2. It broke trend, retested, and failed
3. It collapsed
The RSI and MACD are weak

What happened to Gold last time DXY collapsed?

Trading Signals
Buy Signal: Weekly RSI lows

Sell Signal: Weekly RSI highs

See previous posts for fibonacci extension targets.
Long MGC futures Feb(G)2021
Trading is risky and should not be attempted, ever.
Why?
The DXY.
As we can see on the monthly DXY chart, the developing pattern parallels history.
1. It bounced off the 200 EMA
2. It broke trend, retested, and failed
3. It collapsed
The RSI and MACD are weak
What happened to Gold last time DXY collapsed?
Trading Signals
Buy Signal: Weekly RSI lows
Sell Signal: Weekly RSI highs
See previous posts for fibonacci extension targets.
Long MGC futures Feb(G)2021
Trading is risky and should not be attempted, ever.
Nota
Gold approaching major trendline, filtering out those big algo driven deviations in price. Have been accumulating shares of PHYS and CEF however, waiting to add to f u t u res position once the MACD drifts decisively above the zero bound.As mentioned previously even though the dominate trend is more correlated with Bonds, the DXY is impacting Gold at this time. Watching for another DXY leg down followed by a sharp, temporary recovery.
Trade fechado: stop atingido
Technicals broke down and got stopped out (on MGC futures) but will pick it back up once there is a supportive daily candle. 
Publicações relacionadas
Aviso legal
As informações e publicações não se destinam a ser, e não constituem, conselhos ou recomendações financeiras, de investimento, comerciais ou de outro tipo fornecidos ou endossados pela TradingView. Leia mais nos Termos de Uso.
Publicações relacionadas
Aviso legal
As informações e publicações não se destinam a ser, e não constituem, conselhos ou recomendações financeiras, de investimento, comerciais ou de outro tipo fornecidos ou endossados pela TradingView. Leia mais nos Termos de Uso.