
Amid Recurring Tensions in the Middle East: How to Position for Gold
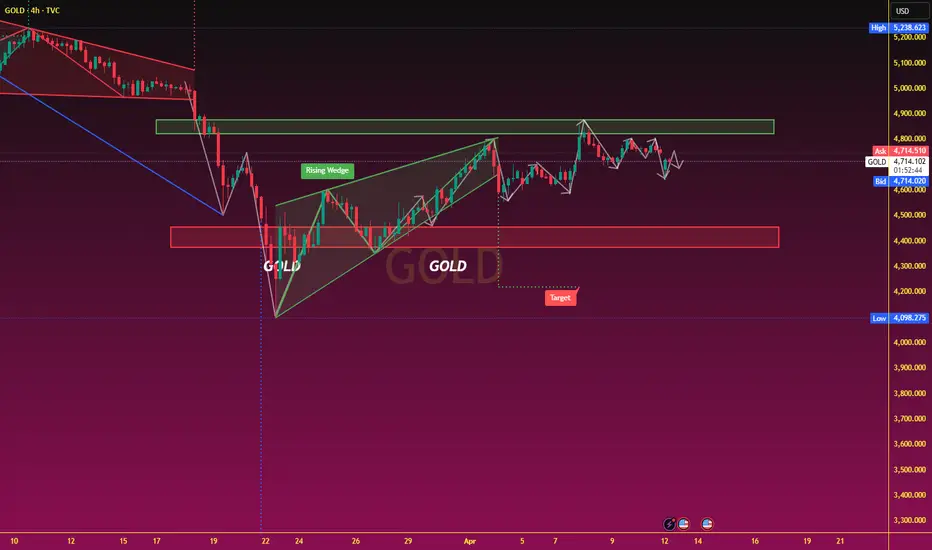
From a technical perspective, the daily chart structure indicates that the RSI has retreated from overbought territory, signaling a weakening of bullish momentum. Gold prices are currently exhibiting a pattern of high-level consolidation with a bearish bias. Key resistance levels are situated in the $4,751 to $4,789 range, while support is concentrated around $4,621 and $4,587.
On the 4-hour timeframe, gold's short-term trajectory displays a pattern of choppy decline; notably, a price gap formed earlier has failed to close quickly, suggesting that selling pressure from above remains persistent. Should the price break below the $4,600 support level, it could proceed to test the $4,550 zone; conversely, if it manages to firmly re-establish itself above $4,750, it holds the potential to reverse its recent short-term decline and close the aforementioned gap.
From a technical perspective, the daily chart structure indicates that the RSI has retreated from overbought territory, signaling a weakening of bullish momentum. Gold prices are currently exhibiting a pattern of high-level consolidation with a bearish bias. Key resistance levels are situated in the $4,751 to $4,789 range, while support is concentrated around $4,621 and $4,587.
On the 4-hour timeframe, gold's short-term trajectory displays a pattern of choppy decline; notably, a price gap formed earlier has failed to close quickly, suggesting that selling pressure from above remains persistent. Should the price break below the $4,600 support level, it could proceed to test the $4,550 zone; conversely, if it manages to firmly re-establish itself above $4,750, it holds the potential to reverse its recent short-term decline and close the aforementioned gap.

Aviso legal
As informações e publicações não se destinam a ser, e não constituem, conselhos ou recomendações financeiras, de investimento, comerciais ou de outro tipo fornecidos ou endossados pela TradingView. Leia mais nos Termos de Uso.
Aviso legal
As informações e publicações não se destinam a ser, e não constituem, conselhos ou recomendações financeiras, de investimento, comerciais ou de outro tipo fornecidos ou endossados pela TradingView. Leia mais nos Termos de Uso.