
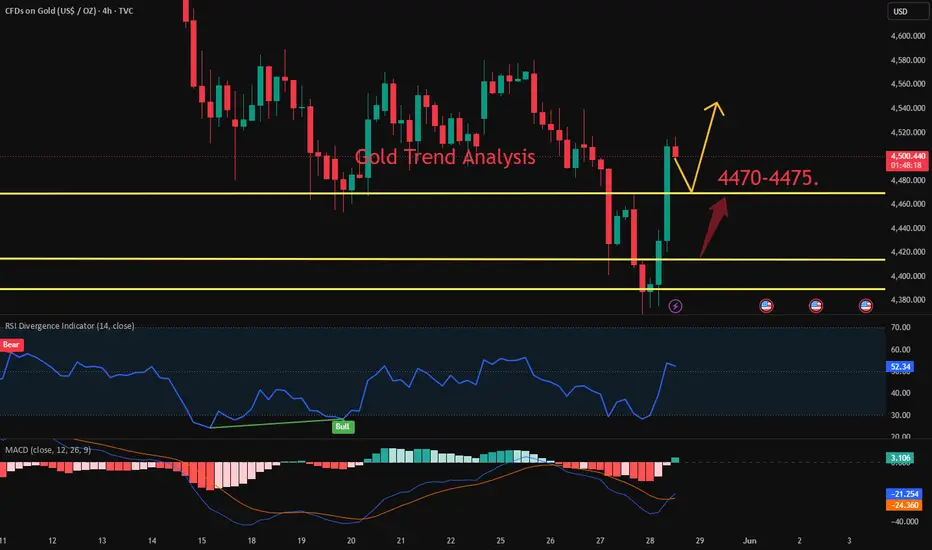
4-Hour Chart Analysis:
Gold has broken out of the $4460-70 supply zone, which has now turned into a short-term dynamic support level. The immediate resistance level is at $4530-4550—the very price range that triggered Wednesday's decline and sell-off.
Trading Strategy:
Buy at $4460-65
Add to your position gradually on pullbacks to $4420-25 (add to your position at this level)

Aviso legal
As informações e publicações não se destinam a ser, e não constituem, conselhos ou recomendações financeiras, de investimento, comerciais ou de outro tipo fornecidos ou endossados pela TradingView. Leia mais nos Termos de Uso.
Aviso legal
As informações e publicações não se destinam a ser, e não constituem, conselhos ou recomendações financeiras, de investimento, comerciais ou de outro tipo fornecidos ou endossados pela TradingView. Leia mais nos Termos de Uso.