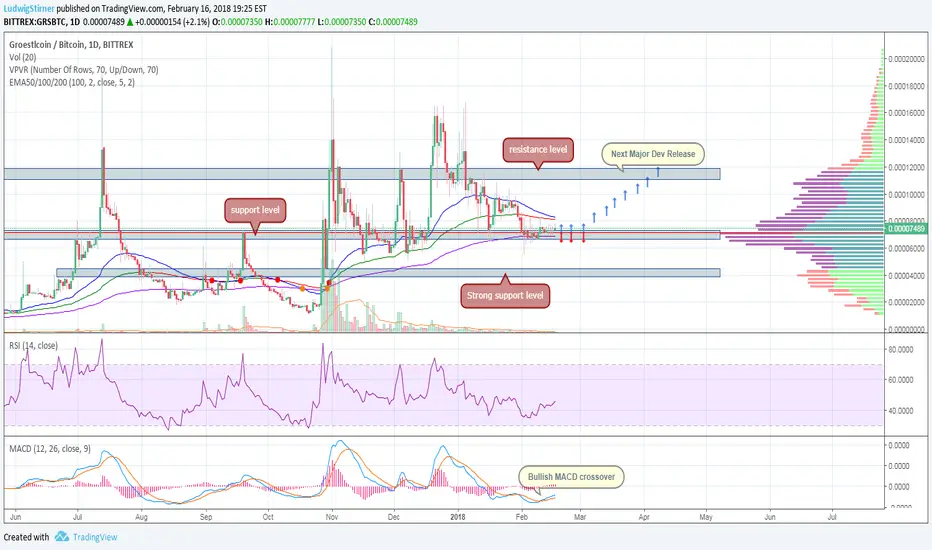
Moreover, the downside pressure seems to be weakening, while the technical indicators are endorsing the bullish scenario. From the technical point of view, in the short-term timeframe, the MACD indicator is approaching the positive bullish crossover, while the RSI is moving slightly higher above the oversold zone. Also, the price has just hit the 200-Day EMA near 6k Sats.
Further gains could see the resistance barrier, which overlaps with the 50-Day and 100-Day EMA. A jump above the aforementioned obstacle could reinforce the bullish structure in the short-term and open the way towards the next key resistance at 10k Sats.
Further gains could see the resistance barrier, which overlaps with the 50-Day and 100-Day EMA. A jump above the aforementioned obstacle could reinforce the bullish structure in the short-term and open the way towards the next key resistance at 10k Sats.

Aviso legal
As informações e publicações não se destinam a ser, e não constituem, conselhos ou recomendações financeiras, de investimento, comerciais ou de outro tipo fornecidos ou endossados pela TradingView. Leia mais nos Termos de Uso.
Aviso legal
As informações e publicações não se destinam a ser, e não constituem, conselhos ou recomendações financeiras, de investimento, comerciais ou de outro tipo fornecidos ou endossados pela TradingView. Leia mais nos Termos de Uso.