
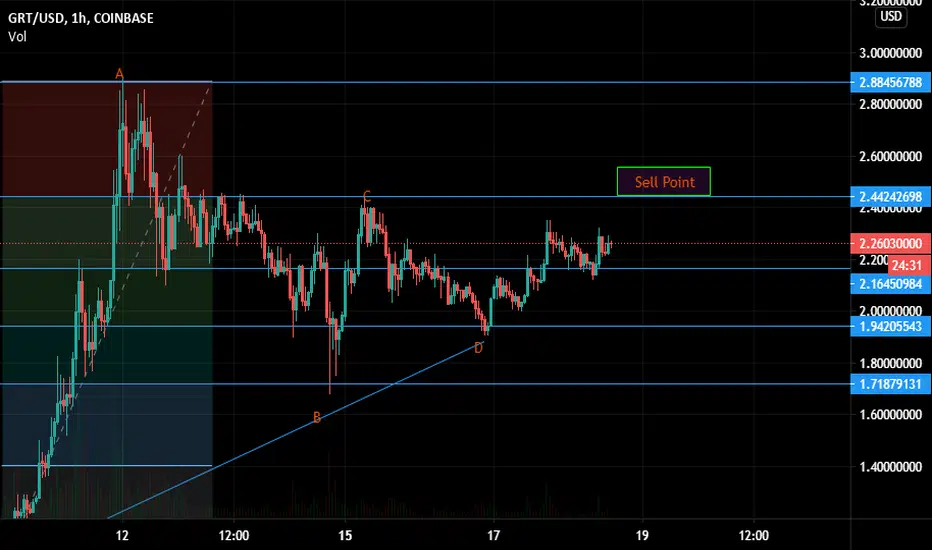
Trying my hand at a FIB on GRT looking at a bullish Gartley Wave. First buy was at D 1.94 sold at 2.25 next long at 2.15 next sell point 2.44 - 2.55 if we break 2.44 tonight. Will re enter at 2.44 after run up. and place next long.
Looking for honest feedback as I am learning this strategy.
Looking for honest feedback as I am learning this strategy.

Aviso legal
As informações e publicações não se destinam a ser, e não constituem, conselhos ou recomendações financeiras, de investimento, comerciais ou de outro tipo fornecidos ou endossados pela TradingView. Leia mais nos Termos de Uso.
Aviso legal
As informações e publicações não se destinam a ser, e não constituem, conselhos ou recomendações financeiras, de investimento, comerciais ou de outro tipo fornecidos ou endossados pela TradingView. Leia mais nos Termos de Uso.