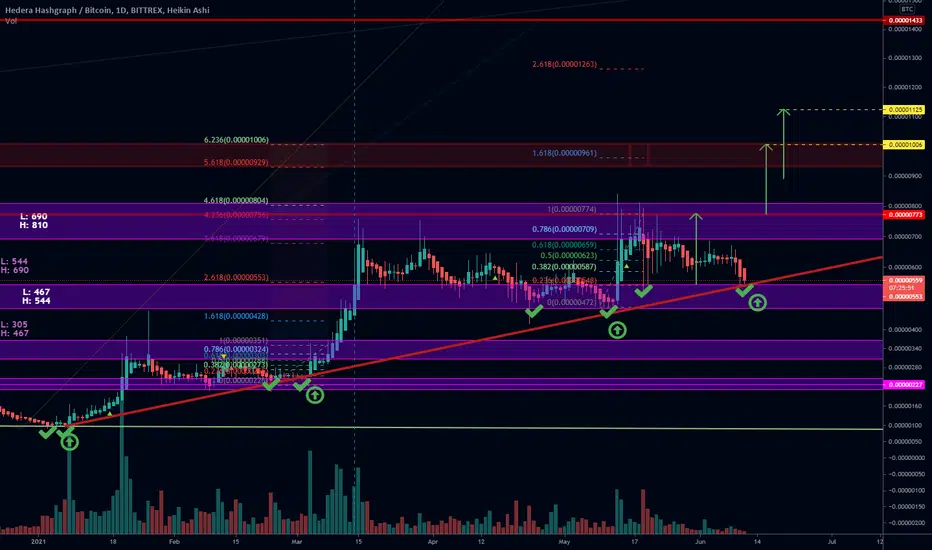
Our trend line has acted as a pivot for the last 3 moves, each time we found a bottom, twice, which ended near the trend line, and followed with a significant move up. Assuming this occurs again and we don't break below the trend line, we can expect a move to ~1000 sats, possibly as high as 1125.
Close below the trend line on the daily invalidates the trade. Possible outcomes of a break below the trend line are:
- repeating pattern idea:
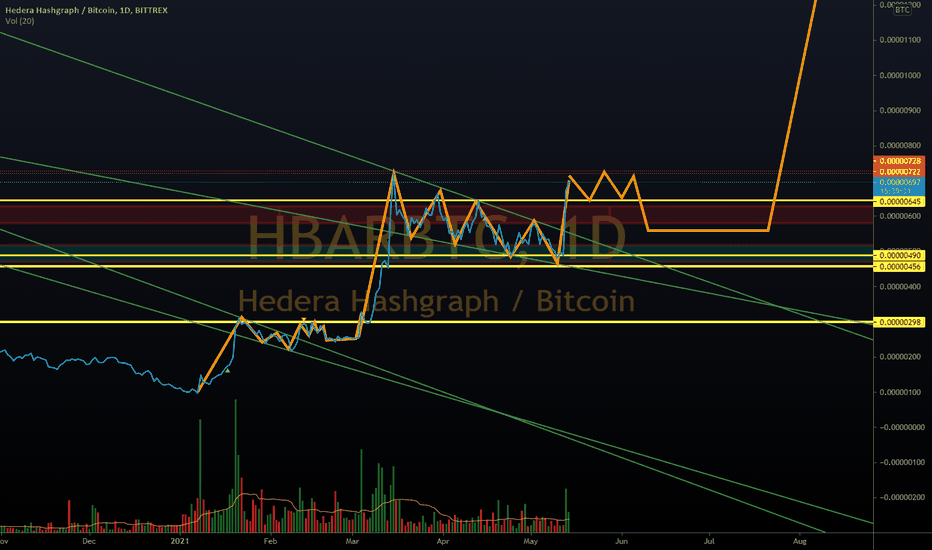
- triple bottom vs. btc (or a giant HSi may form)
Chart from this post is Heiken Ashi daily chart, levels were drawn using multiple time-frames, main trend line is drawn from daily candlestick. Targets are chosen via double bottom projection and fibs.
2 Hour Candlestick Chart zoomed in:

Daily Candlestick Chart, also zoomed in:

Close below the trend line on the daily invalidates the trade. Possible outcomes of a break below the trend line are:
- repeating pattern idea:
- triple bottom vs. btc (or a giant HSi may form)
Chart from this post is Heiken Ashi daily chart, levels were drawn using multiple time-frames, main trend line is drawn from daily candlestick. Targets are chosen via double bottom projection and fibs.
2 Hour Candlestick Chart zoomed in:
Daily Candlestick Chart, also zoomed in:
Nota
Here's another interesting look, what if HBAR / BTC weekly is in a parallel channel (same scenarios still apply as described above):
Aviso legal
As informações e publicações não se destinam a ser, e não constituem, conselhos ou recomendações financeiras, de investimento, comerciais ou de outro tipo fornecidos ou endossados pela TradingView. Leia mais nos Termos de Uso.
Aviso legal
As informações e publicações não se destinam a ser, e não constituem, conselhos ou recomendações financeiras, de investimento, comerciais ou de outro tipo fornecidos ou endossados pela TradingView. Leia mais nos Termos de Uso.