
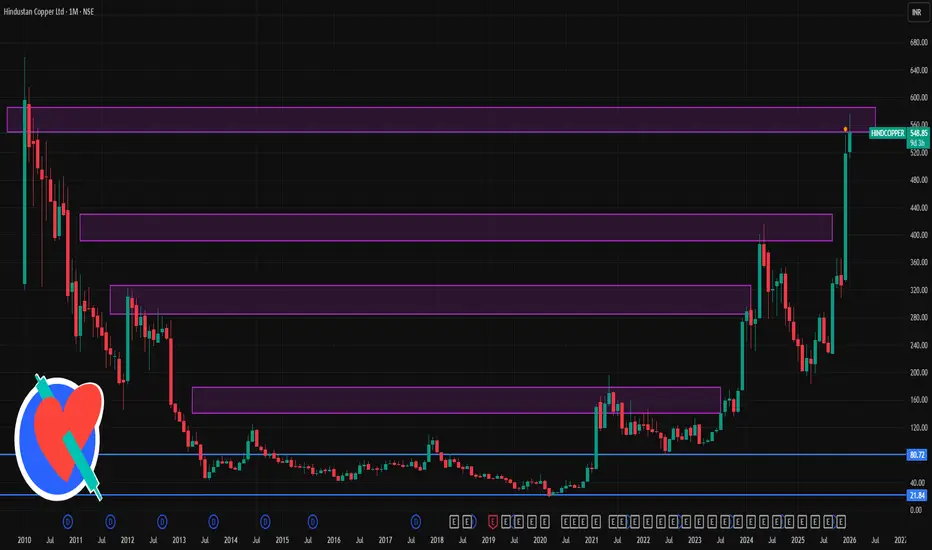
📊 Current Reference Price
The stock is trading around ₹540 – ₹560 on the NSE today.
🧠 1‑Month Timeframe Key Levels
📈 Resistance (Upside Barriers)
These are levels where the stock might face selling pressure or pauses if it continues higher:
1. ₹570 – ₹575 — Immediate near‑term resistance zone (recent highs).
2. ₹580 – ₹585 — Next resistance cluster above current price — psychological plus pivot area.
3. ₹595 – ₹600+ — Extended upside target if price breaks above the near zone.
Interpretation: A daily/weekly close above ~₹575–₹580 can confirm strength on the 1‑month chart and open the move toward ~₹600+.
📉 Support (Downside Floors)
These are levels where buyers may step in if price corrects:
1. ₹522 – ₹525 — Near pivot support on medium timeframe.
2. ₹500 – ₹510 — Secondary support zone that has seen demand historically on pullbacks.
3. ₹480 – ₹490 — Deeper short‑term support — a key level if price weakens further.
Interpretation: Holds above ~₹520–₹525 are bullish for the 1‑month swing; breaks below that raise risk of deeper pullback toward ₹500 or lower.
✍️ 1‑Month Trading Perspective (Short Summary)
📌 Bullish Scenario
Sustained daily closes above ~₹575–₹580 → watch ₹590–₹600+ as next short‑term targets.
📌 Neutral / Range Scenario
Price consolidates between ₹525 and ₹575 — likely choppy movement before next directional breakout.
📌 Bearish / Correction Scenario
Close below ~₹522–₹525 → deeper support zones around ₹500–₹490 may get tested.
⚠️ Important Notes
✅ These are technical reference levels, not buy/sell recommendations.
✅ Price action can change quickly with market news, global copper trends, or broader index moves (e.g., Nifty/commodity dynamics).
The stock is trading around ₹540 – ₹560 on the NSE today.
🧠 1‑Month Timeframe Key Levels
📈 Resistance (Upside Barriers)
These are levels where the stock might face selling pressure or pauses if it continues higher:
1. ₹570 – ₹575 — Immediate near‑term resistance zone (recent highs).
2. ₹580 – ₹585 — Next resistance cluster above current price — psychological plus pivot area.
3. ₹595 – ₹600+ — Extended upside target if price breaks above the near zone.
Interpretation: A daily/weekly close above ~₹575–₹580 can confirm strength on the 1‑month chart and open the move toward ~₹600+.
📉 Support (Downside Floors)
These are levels where buyers may step in if price corrects:
1. ₹522 – ₹525 — Near pivot support on medium timeframe.
2. ₹500 – ₹510 — Secondary support zone that has seen demand historically on pullbacks.
3. ₹480 – ₹490 — Deeper short‑term support — a key level if price weakens further.
Interpretation: Holds above ~₹520–₹525 are bullish for the 1‑month swing; breaks below that raise risk of deeper pullback toward ₹500 or lower.
✍️ 1‑Month Trading Perspective (Short Summary)
📌 Bullish Scenario
Sustained daily closes above ~₹575–₹580 → watch ₹590–₹600+ as next short‑term targets.
📌 Neutral / Range Scenario
Price consolidates between ₹525 and ₹575 — likely choppy movement before next directional breakout.
📌 Bearish / Correction Scenario
Close below ~₹522–₹525 → deeper support zones around ₹500–₹490 may get tested.
⚠️ Important Notes
✅ These are technical reference levels, not buy/sell recommendations.
✅ Price action can change quickly with market news, global copper trends, or broader index moves (e.g., Nifty/commodity dynamics).

Contact Knowledgehub for a detailed consultation: Dm on WhatsApp: [wa.link/a2o0kz]-
Phone No: [+91 93102 26243]-
Email: [tradingviewknowledgehub@gmail.com]---
-- Let’s achieve success together!
Phone No: [+91 93102 26243]-
Email: [tradingviewknowledgehub@gmail.com]---
-- Let’s achieve success together!
Publicações relacionadas
Aviso legal
As informações e publicações não se destinam a ser, e não constituem, conselhos ou recomendações financeiras, de investimento, comerciais ou de outro tipo fornecidos ou endossados pela TradingView. Leia mais nos Termos de Uso.
Contact Knowledgehub for a detailed consultation: Dm on WhatsApp: [wa.link/a2o0kz]-
Phone No: [+91 93102 26243]-
Email: [tradingviewknowledgehub@gmail.com]---
-- Let’s achieve success together!
Phone No: [+91 93102 26243]-
Email: [tradingviewknowledgehub@gmail.com]---
-- Let’s achieve success together!
Publicações relacionadas
Aviso legal
As informações e publicações não se destinam a ser, e não constituem, conselhos ou recomendações financeiras, de investimento, comerciais ou de outro tipo fornecidos ou endossados pela TradingView. Leia mais nos Termos de Uso.